Scottish vs Immigrants from Haiti Single Father Households
COMPARE
Scottish
Immigrants from Haiti
Single Father Households
Single Father Households Comparison
Scottish
Immigrants from Haiti
2.3%
SINGLE FATHER HOUSEHOLDS
72.8/ 100
METRIC RATING
162nd/ 347
METRIC RANK
2.6%
SINGLE FATHER HOUSEHOLDS
0.1/ 100
METRIC RATING
276th/ 347
METRIC RANK
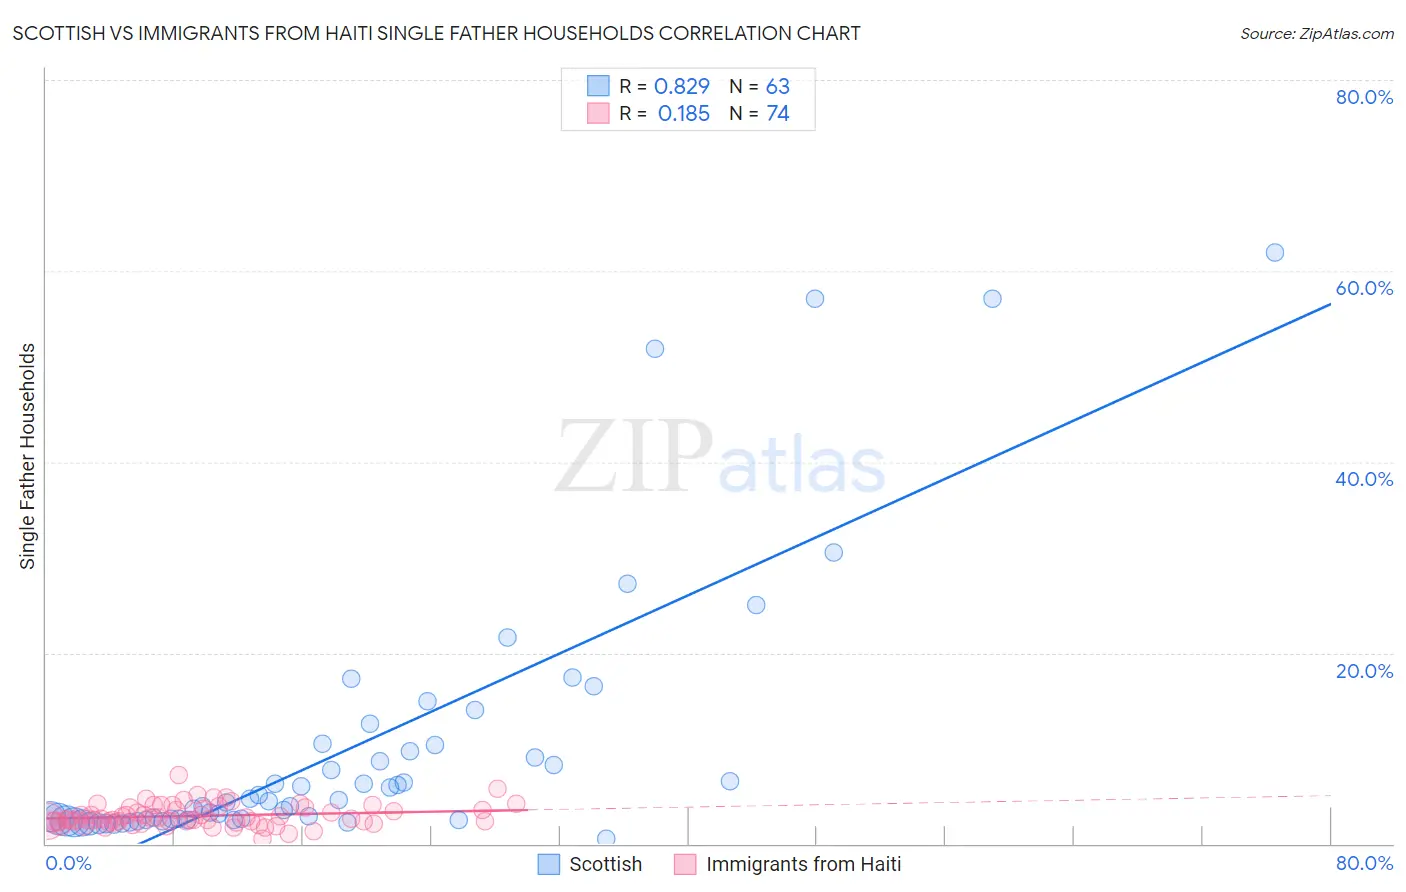
Scottish vs Immigrants from Haiti Single Father Households Correlation Chart
The statistical analysis conducted on geographies consisting of 551,948,135 people shows a very strong positive correlation between the proportion of Scottish and percentage of single father households in the United States with a correlation coefficient (R) of 0.829 and weighted average of 2.3%. Similarly, the statistical analysis conducted on geographies consisting of 223,962,598 people shows a poor positive correlation between the proportion of Immigrants from Haiti and percentage of single father households in the United States with a correlation coefficient (R) of 0.185 and weighted average of 2.6%, a difference of 14.2%.
Single Father Households Correlation Summary
| Measurement | Scottish | Immigrants from Haiti |
| Minimum | 0.58% | 0.50% |
| Maximum | 61.9% | 7.3% |
| Range | 61.3% | 6.8% |
| Mean | 10.1% | 2.9% |
| Median | 4.4% | 2.6% |
| Interquartile 25% (IQ1) | 2.5% | 2.3% |
| Interquartile 75% (IQ3) | 10.3% | 3.7% |
| Interquartile Range (IQR) | 7.8% | 1.4% |
| Standard Deviation (Sample) | 14.0% | 1.1% |
| Standard Deviation (Population) | 13.8% | 1.1% |
Similar Demographics by Single Father Households
Demographics Similar to Scottish by Single Father Households
In terms of single father households, the demographic groups most similar to Scottish are Swiss (2.3%, a difference of 0.030%), Irish (2.3%, a difference of 0.070%), Pakistani (2.3%, a difference of 0.21%), Scotch-Irish (2.3%, a difference of 0.31%), and Immigrants from Bolivia (2.3%, a difference of 0.34%).
| Demographics | Rating | Rank | Single Father Households |
| Europeans | 80.9 /100 | #155 | Excellent 2.3% |
| Immigrants | South America | 79.9 /100 | #156 | Good 2.3% |
| Canadians | 79.7 /100 | #157 | Good 2.3% |
| Immigrants | Senegal | 79.4 /100 | #158 | Good 2.3% |
| Immigrants | West Indies | 77.9 /100 | #159 | Good 2.3% |
| Immigrants | Bolivia | 76.3 /100 | #160 | Good 2.3% |
| Swiss | 73.2 /100 | #161 | Good 2.3% |
| Scottish | 72.8 /100 | #162 | Good 2.3% |
| Irish | 72.1 /100 | #163 | Good 2.3% |
| Pakistanis | 70.6 /100 | #164 | Good 2.3% |
| Scotch-Irish | 69.4 /100 | #165 | Good 2.3% |
| English | 68.6 /100 | #166 | Good 2.3% |
| South Americans | 64.3 /100 | #167 | Good 2.3% |
| Icelanders | 63.1 /100 | #168 | Good 2.3% |
| Czechs | 62.5 /100 | #169 | Good 2.3% |
Demographics Similar to Immigrants from Haiti by Single Father Households
In terms of single father households, the demographic groups most similar to Immigrants from Haiti are Shoshone (2.6%, a difference of 0.030%), Cherokee (2.6%, a difference of 0.080%), Samoan (2.6%, a difference of 0.12%), Immigrants from Dominican Republic (2.6%, a difference of 0.21%), and Puerto Rican (2.6%, a difference of 0.63%).
| Demographics | Rating | Rank | Single Father Households |
| Cubans | 0.3 /100 | #269 | Tragic 2.6% |
| Seminole | 0.3 /100 | #270 | Tragic 2.6% |
| Creek | 0.2 /100 | #271 | Tragic 2.6% |
| Belizeans | 0.2 /100 | #272 | Tragic 2.6% |
| Iroquois | 0.2 /100 | #273 | Tragic 2.6% |
| Puerto Ricans | 0.2 /100 | #274 | Tragic 2.6% |
| Immigrants | Dominican Republic | 0.2 /100 | #275 | Tragic 2.6% |
| Immigrants | Haiti | 0.1 /100 | #276 | Tragic 2.6% |
| Shoshone | 0.1 /100 | #277 | Tragic 2.6% |
| Cherokee | 0.1 /100 | #278 | Tragic 2.6% |
| Samoans | 0.1 /100 | #279 | Tragic 2.6% |
| Immigrants | Portugal | 0.1 /100 | #280 | Tragic 2.6% |
| Nicaraguans | 0.1 /100 | #281 | Tragic 2.6% |
| Dutch West Indians | 0.1 /100 | #282 | Tragic 2.6% |
| Immigrants | Nicaragua | 0.1 /100 | #283 | Tragic 2.7% |