Immigrants from Kazakhstan vs Immigrants from Japan Single Father Households
COMPARE
Immigrants from Kazakhstan
Immigrants from Japan
Single Father Households
Single Father Households Comparison
Immigrants from Kazakhstan
Immigrants from Japan
2.0%
SINGLE FATHER HOUSEHOLDS
99.9/ 100
METRIC RATING
48th/ 347
METRIC RANK
2.0%
SINGLE FATHER HOUSEHOLDS
100.0/ 100
METRIC RATING
28th/ 347
METRIC RANK
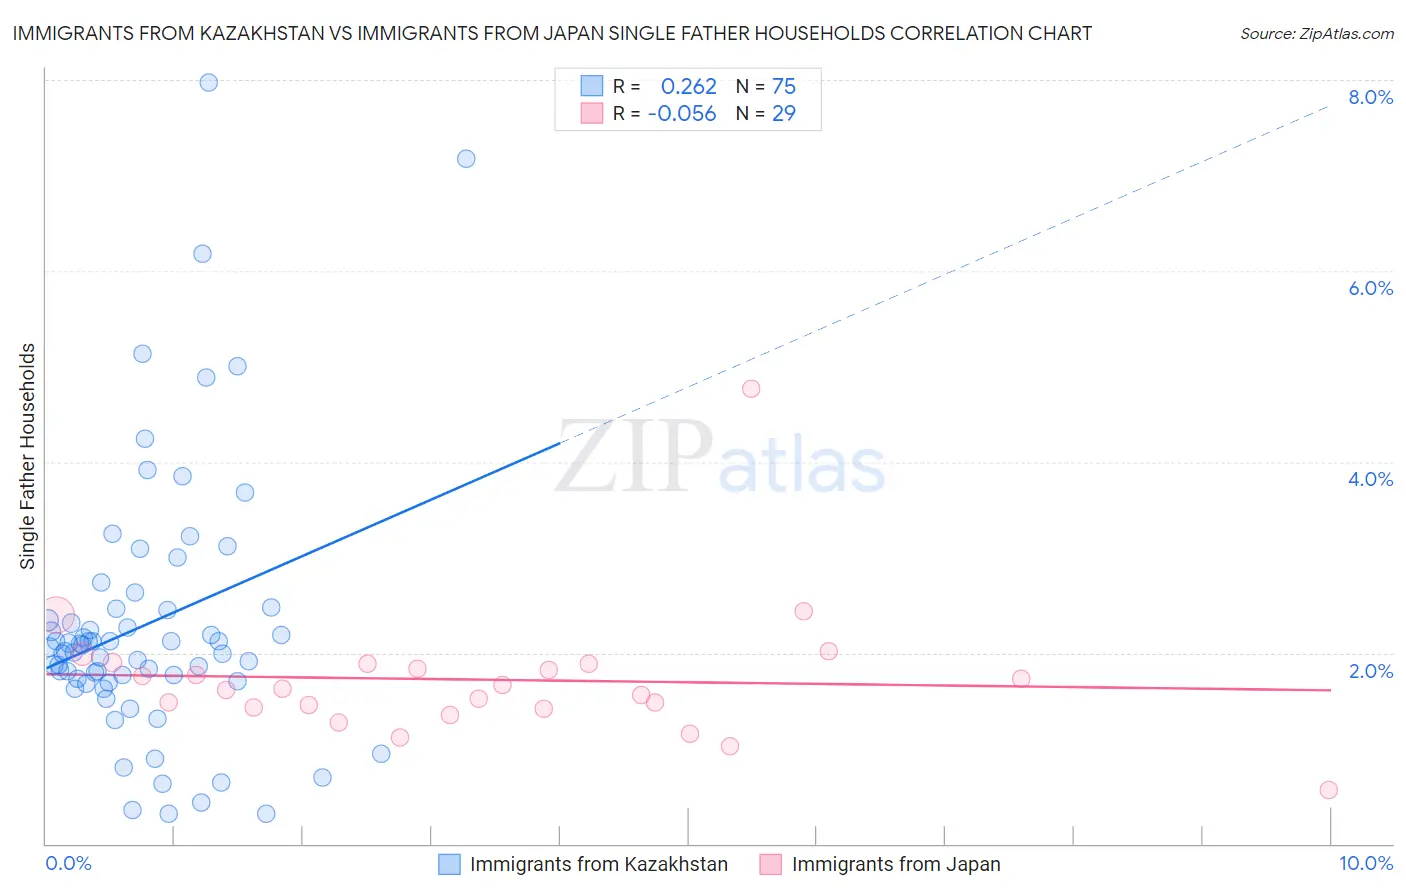
Immigrants from Kazakhstan vs Immigrants from Japan Single Father Households Correlation Chart
The statistical analysis conducted on geographies consisting of 124,033,053 people shows a weak positive correlation between the proportion of Immigrants from Kazakhstan and percentage of single father households in the United States with a correlation coefficient (R) of 0.262 and weighted average of 2.0%. Similarly, the statistical analysis conducted on geographies consisting of 337,808,657 people shows a slight negative correlation between the proportion of Immigrants from Japan and percentage of single father households in the United States with a correlation coefficient (R) of -0.056 and weighted average of 2.0%, a difference of 2.4%.
Single Father Households Correlation Summary
| Measurement | Immigrants from Kazakhstan | Immigrants from Japan |
| Minimum | 0.31% | 0.57% |
| Maximum | 8.0% | 4.8% |
| Range | 7.7% | 4.2% |
| Mean | 2.3% | 1.7% |
| Median | 2.1% | 1.6% |
| Interquartile 25% (IQ1) | 1.7% | 1.4% |
| Interquartile 75% (IQ3) | 2.5% | 1.9% |
| Interquartile Range (IQR) | 0.77% | 0.46% |
| Standard Deviation (Sample) | 1.4% | 0.70% |
| Standard Deviation (Population) | 1.4% | 0.69% |
Demographics Similar to Immigrants from Kazakhstan and Immigrants from Japan by Single Father Households
In terms of single father households, the demographic groups most similar to Immigrants from Kazakhstan are Immigrants from Ukraine (2.0%, a difference of 0.020%), Immigrants from Lebanon (2.0%, a difference of 0.37%), Russian (2.0%, a difference of 0.48%), Latvian (2.0%, a difference of 0.49%), and Immigrants from Grenada (2.0%, a difference of 0.58%). Similarly, the demographic groups most similar to Immigrants from Japan are Bulgarian (2.0%, a difference of 0.090%), Cambodian (2.0%, a difference of 0.11%), Israeli (2.0%, a difference of 0.14%), Chinese (2.0%, a difference of 0.18%), and Turkish (2.0%, a difference of 0.39%).
| Demographics | Rating | Rank | Single Father Households |
| Immigrants | Japan | 100.0 /100 | #28 | Exceptional 2.0% |
| Bulgarians | 100.0 /100 | #29 | Exceptional 2.0% |
| Cambodians | 100.0 /100 | #30 | Exceptional 2.0% |
| Israelis | 100.0 /100 | #31 | Exceptional 2.0% |
| Chinese | 100.0 /100 | #32 | Exceptional 2.0% |
| Turks | 100.0 /100 | #33 | Exceptional 2.0% |
| Immigrants | Australia | 100.0 /100 | #34 | Exceptional 2.0% |
| Albanians | 100.0 /100 | #35 | Exceptional 2.0% |
| Immigrants | Belgium | 100.0 /100 | #36 | Exceptional 2.0% |
| Immigrants | St. Vincent and the Grenadines | 100.0 /100 | #37 | Exceptional 2.0% |
| Immigrants | Eastern Europe | 100.0 /100 | #38 | Exceptional 2.0% |
| Immigrants | Sri Lanka | 100.0 /100 | #39 | Exceptional 2.0% |
| Immigrants | Bulgaria | 100.0 /100 | #40 | Exceptional 2.0% |
| Immigrants | Turkey | 100.0 /100 | #41 | Exceptional 2.0% |
| Macedonians | 100.0 /100 | #42 | Exceptional 2.0% |
| Immigrants | Grenada | 100.0 /100 | #43 | Exceptional 2.0% |
| Latvians | 100.0 /100 | #44 | Exceptional 2.0% |
| Russians | 100.0 /100 | #45 | Exceptional 2.0% |
| Immigrants | Lebanon | 100.0 /100 | #46 | Exceptional 2.0% |
| Immigrants | Ukraine | 99.9 /100 | #47 | Exceptional 2.0% |
| Immigrants | Kazakhstan | 99.9 /100 | #48 | Exceptional 2.0% |