Colombian vs Immigrants from Japan Single Father Households
COMPARE
Colombian
Immigrants from Japan
Single Father Households
Single Father Households Comparison
Colombians
Immigrants from Japan
2.3%
SINGLE FATHER HOUSEHOLDS
48.0/ 100
METRIC RATING
177th/ 347
METRIC RANK
2.0%
SINGLE FATHER HOUSEHOLDS
100.0/ 100
METRIC RATING
28th/ 347
METRIC RANK
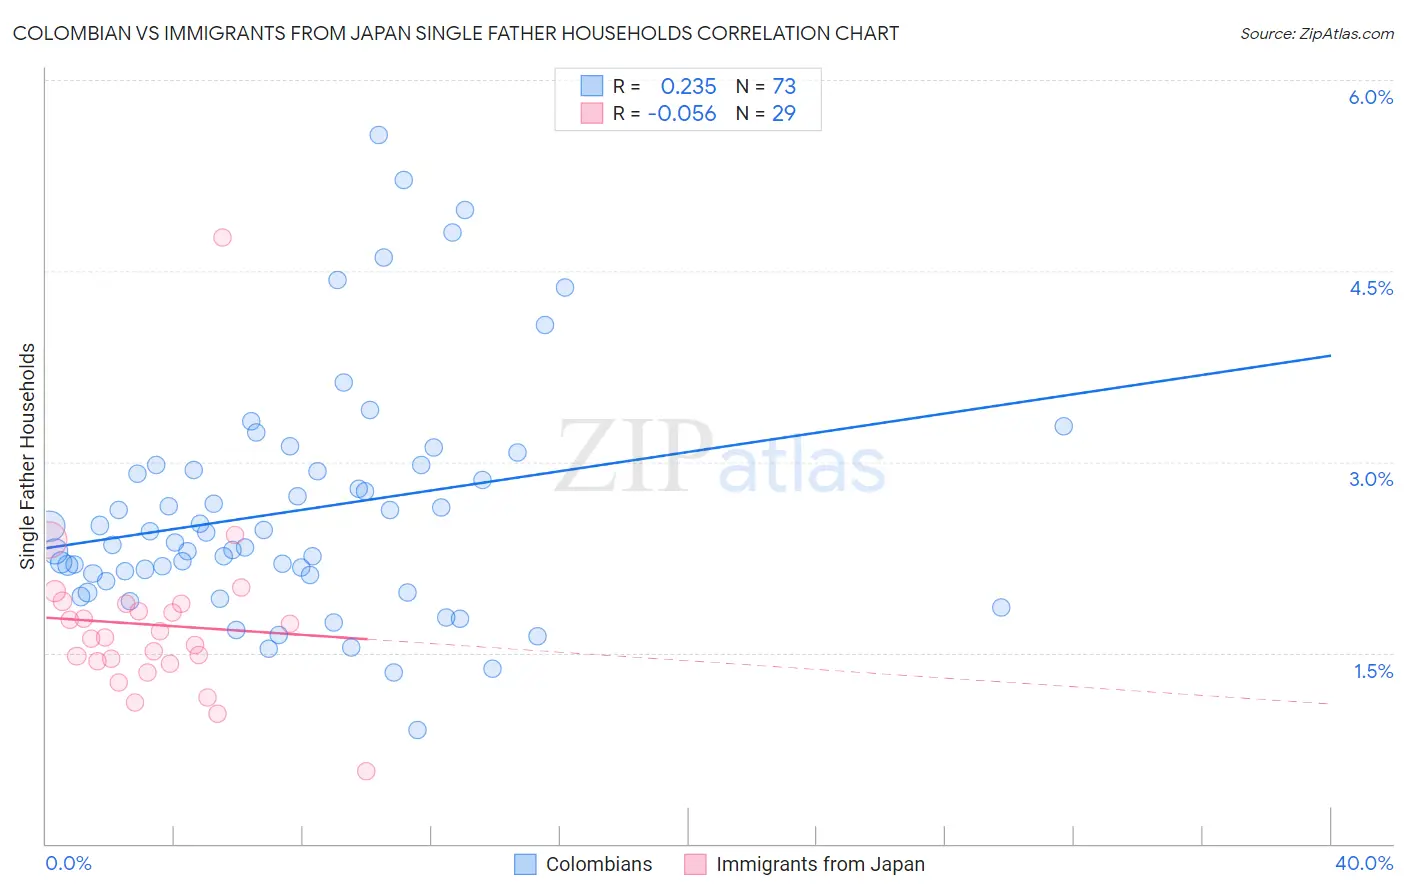
Colombian vs Immigrants from Japan Single Father Households Correlation Chart
The statistical analysis conducted on geographies consisting of 415,821,309 people shows a weak positive correlation between the proportion of Colombians and percentage of single father households in the United States with a correlation coefficient (R) of 0.235 and weighted average of 2.3%. Similarly, the statistical analysis conducted on geographies consisting of 337,808,657 people shows a slight negative correlation between the proportion of Immigrants from Japan and percentage of single father households in the United States with a correlation coefficient (R) of -0.056 and weighted average of 2.0%, a difference of 18.9%.
Single Father Households Correlation Summary
| Measurement | Colombian | Immigrants from Japan |
| Minimum | 0.89% | 0.57% |
| Maximum | 5.6% | 4.8% |
| Range | 4.7% | 4.2% |
| Mean | 2.6% | 1.7% |
| Median | 2.4% | 1.6% |
| Interquartile 25% (IQ1) | 2.1% | 1.4% |
| Interquartile 75% (IQ3) | 3.0% | 1.9% |
| Interquartile Range (IQR) | 0.87% | 0.46% |
| Standard Deviation (Sample) | 0.93% | 0.70% |
| Standard Deviation (Population) | 0.92% | 0.69% |
Similar Demographics by Single Father Households
Demographics Similar to Colombians by Single Father Households
In terms of single father households, the demographic groups most similar to Colombians are Danish (2.3%, a difference of 0.010%), Immigrants from Jamaica (2.3%, a difference of 0.080%), Afghan (2.3%, a difference of 0.14%), Costa Rican (2.3%, a difference of 0.29%), and Welsh (2.3%, a difference of 0.30%).
| Demographics | Rating | Rank | Single Father Households |
| Ugandans | 62.2 /100 | #170 | Good 2.3% |
| Swedes | 61.6 /100 | #171 | Good 2.3% |
| Czechoslovakians | 58.9 /100 | #172 | Average 2.3% |
| Celtics | 55.4 /100 | #173 | Average 2.3% |
| Afghans | 50.0 /100 | #174 | Average 2.3% |
| Immigrants | Jamaica | 49.1 /100 | #175 | Average 2.3% |
| Danes | 48.2 /100 | #176 | Average 2.3% |
| Colombians | 48.0 /100 | #177 | Average 2.3% |
| Costa Ricans | 44.1 /100 | #178 | Average 2.3% |
| Welsh | 44.0 /100 | #179 | Average 2.3% |
| Yugoslavians | 43.9 /100 | #180 | Average 2.3% |
| Jamaicans | 43.5 /100 | #181 | Average 2.3% |
| Belgians | 43.3 /100 | #182 | Average 2.3% |
| Immigrants | Panama | 41.8 /100 | #183 | Average 2.4% |
| Sri Lankans | 41.8 /100 | #184 | Average 2.4% |
Demographics Similar to Immigrants from Japan by Single Father Households
In terms of single father households, the demographic groups most similar to Immigrants from Japan are Bulgarian (2.0%, a difference of 0.090%), Cambodian (2.0%, a difference of 0.11%), Israeli (2.0%, a difference of 0.14%), Immigrants from South Central Asia (2.0%, a difference of 0.18%), and Chinese (2.0%, a difference of 0.18%).
| Demographics | Rating | Rank | Single Father Households |
| Immigrants | Albania | 100.0 /100 | #21 | Exceptional 1.9% |
| Immigrants | Latvia | 100.0 /100 | #22 | Exceptional 1.9% |
| Immigrants | Croatia | 100.0 /100 | #23 | Exceptional 2.0% |
| Immigrants | Russia | 100.0 /100 | #24 | Exceptional 2.0% |
| Eastern Europeans | 100.0 /100 | #25 | Exceptional 2.0% |
| Assyrians/Chaldeans/Syriacs | 100.0 /100 | #26 | Exceptional 2.0% |
| Immigrants | South Central Asia | 100.0 /100 | #27 | Exceptional 2.0% |
| Immigrants | Japan | 100.0 /100 | #28 | Exceptional 2.0% |
| Bulgarians | 100.0 /100 | #29 | Exceptional 2.0% |
| Cambodians | 100.0 /100 | #30 | Exceptional 2.0% |
| Israelis | 100.0 /100 | #31 | Exceptional 2.0% |
| Chinese | 100.0 /100 | #32 | Exceptional 2.0% |
| Turks | 100.0 /100 | #33 | Exceptional 2.0% |
| Immigrants | Australia | 100.0 /100 | #34 | Exceptional 2.0% |
| Albanians | 100.0 /100 | #35 | Exceptional 2.0% |