Scottish vs Immigrants from Hungary Single Father Households
COMPARE
Scottish
Immigrants from Hungary
Single Father Households
Single Father Households Comparison
Scottish
Immigrants from Hungary
2.3%
SINGLE FATHER HOUSEHOLDS
72.8/ 100
METRIC RATING
162nd/ 347
METRIC RANK
2.1%
SINGLE FATHER HOUSEHOLDS
99.6/ 100
METRIC RATING
85th/ 347
METRIC RANK
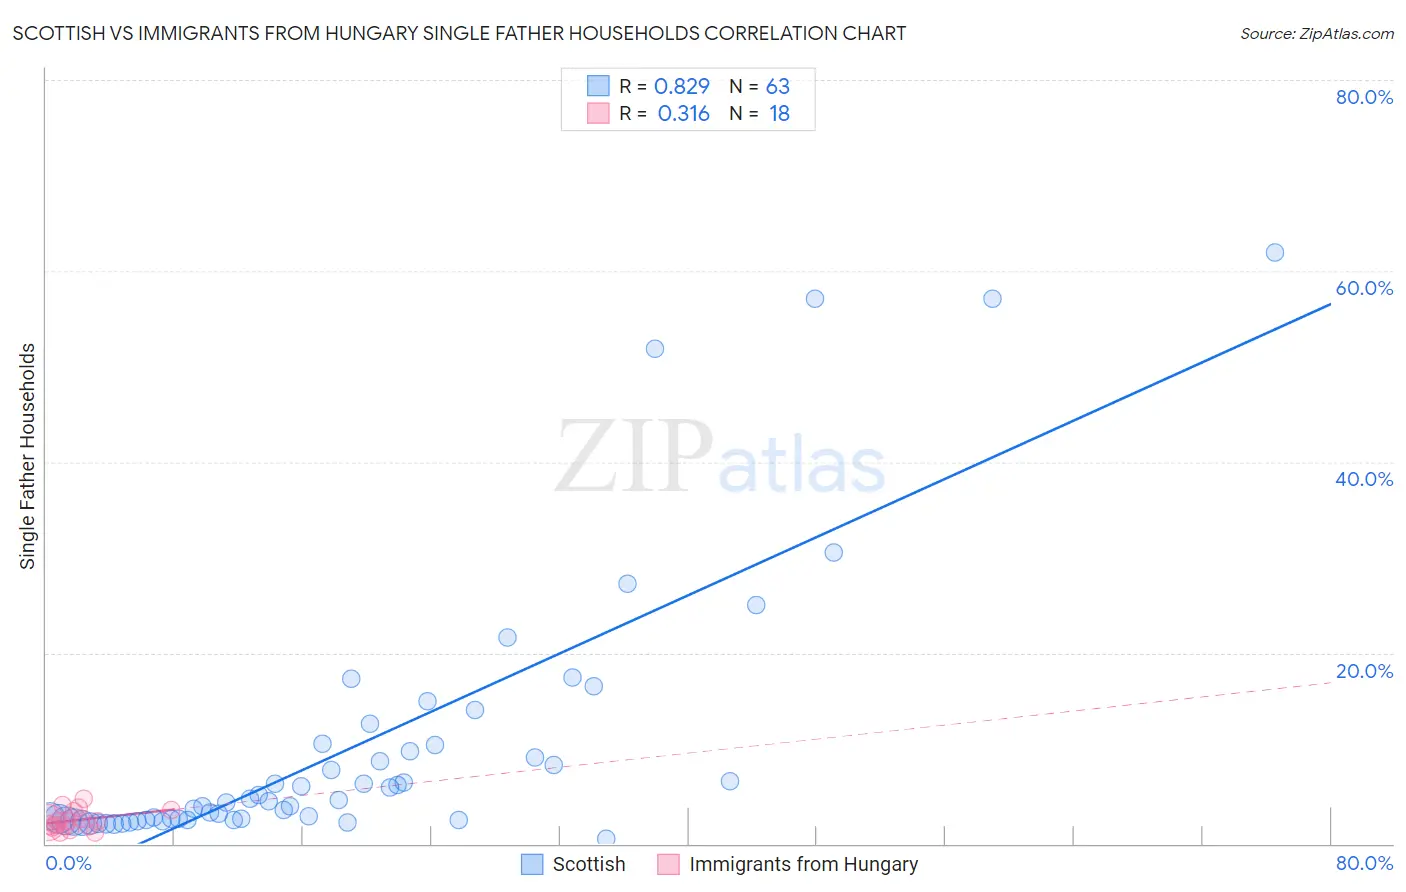
Scottish vs Immigrants from Hungary Single Father Households Correlation Chart
The statistical analysis conducted on geographies consisting of 551,948,135 people shows a very strong positive correlation between the proportion of Scottish and percentage of single father households in the United States with a correlation coefficient (R) of 0.829 and weighted average of 2.3%. Similarly, the statistical analysis conducted on geographies consisting of 194,547,582 people shows a mild positive correlation between the proportion of Immigrants from Hungary and percentage of single father households in the United States with a correlation coefficient (R) of 0.316 and weighted average of 2.1%, a difference of 9.4%.
Single Father Households Correlation Summary
| Measurement | Scottish | Immigrants from Hungary |
| Minimum | 0.58% | 1.1% |
| Maximum | 61.9% | 4.7% |
| Range | 61.3% | 3.6% |
| Mean | 10.1% | 2.5% |
| Median | 4.4% | 2.3% |
| Interquartile 25% (IQ1) | 2.5% | 1.8% |
| Interquartile 75% (IQ3) | 10.3% | 3.3% |
| Interquartile Range (IQR) | 7.8% | 1.5% |
| Standard Deviation (Sample) | 14.0% | 1.0% |
| Standard Deviation (Population) | 13.8% | 1.00% |
Similar Demographics by Single Father Households
Demographics Similar to Scottish by Single Father Households
In terms of single father households, the demographic groups most similar to Scottish are Swiss (2.3%, a difference of 0.030%), Irish (2.3%, a difference of 0.070%), Pakistani (2.3%, a difference of 0.21%), Scotch-Irish (2.3%, a difference of 0.31%), and Immigrants from Bolivia (2.3%, a difference of 0.34%).
| Demographics | Rating | Rank | Single Father Households |
| Europeans | 80.9 /100 | #155 | Excellent 2.3% |
| Immigrants | South America | 79.9 /100 | #156 | Good 2.3% |
| Canadians | 79.7 /100 | #157 | Good 2.3% |
| Immigrants | Senegal | 79.4 /100 | #158 | Good 2.3% |
| Immigrants | West Indies | 77.9 /100 | #159 | Good 2.3% |
| Immigrants | Bolivia | 76.3 /100 | #160 | Good 2.3% |
| Swiss | 73.2 /100 | #161 | Good 2.3% |
| Scottish | 72.8 /100 | #162 | Good 2.3% |
| Irish | 72.1 /100 | #163 | Good 2.3% |
| Pakistanis | 70.6 /100 | #164 | Good 2.3% |
| Scotch-Irish | 69.4 /100 | #165 | Good 2.3% |
| English | 68.6 /100 | #166 | Good 2.3% |
| South Americans | 64.3 /100 | #167 | Good 2.3% |
| Icelanders | 63.1 /100 | #168 | Good 2.3% |
| Czechs | 62.5 /100 | #169 | Good 2.3% |
Demographics Similar to Immigrants from Hungary by Single Father Households
In terms of single father households, the demographic groups most similar to Immigrants from Hungary are Carpatho Rusyn (2.1%, a difference of 0.040%), Asian (2.1%, a difference of 0.080%), Greek (2.1%, a difference of 0.34%), New Zealander (2.1%, a difference of 0.35%), and Armenian (2.1%, a difference of 0.40%).
| Demographics | Rating | Rank | Single Father Households |
| Estonians | 99.7 /100 | #78 | Exceptional 2.1% |
| Immigrants | Asia | 99.7 /100 | #79 | Exceptional 2.1% |
| Immigrants | South Africa | 99.7 /100 | #80 | Exceptional 2.1% |
| Armenians | 99.7 /100 | #81 | Exceptional 2.1% |
| New Zealanders | 99.7 /100 | #82 | Exceptional 2.1% |
| Greeks | 99.7 /100 | #83 | Exceptional 2.1% |
| Carpatho Rusyns | 99.6 /100 | #84 | Exceptional 2.1% |
| Immigrants | Hungary | 99.6 /100 | #85 | Exceptional 2.1% |
| Asians | 99.6 /100 | #86 | Exceptional 2.1% |
| Lithuanians | 99.5 /100 | #87 | Exceptional 2.1% |
| Bhutanese | 99.5 /100 | #88 | Exceptional 2.1% |
| Immigrants | Armenia | 99.5 /100 | #89 | Exceptional 2.1% |
| Immigrants | Pakistan | 99.5 /100 | #90 | Exceptional 2.1% |
| Immigrants | Guyana | 99.4 /100 | #91 | Exceptional 2.1% |
| Romanians | 99.4 /100 | #92 | Exceptional 2.1% |