Scottish vs Uruguayan Single Father Households
COMPARE
Scottish
Uruguayan
Single Father Households
Single Father Households Comparison
Scottish
Uruguayans
2.3%
SINGLE FATHER HOUSEHOLDS
72.8/ 100
METRIC RATING
162nd/ 347
METRIC RANK
2.4%
SINGLE FATHER HOUSEHOLDS
29.7/ 100
METRIC RATING
193rd/ 347
METRIC RANK
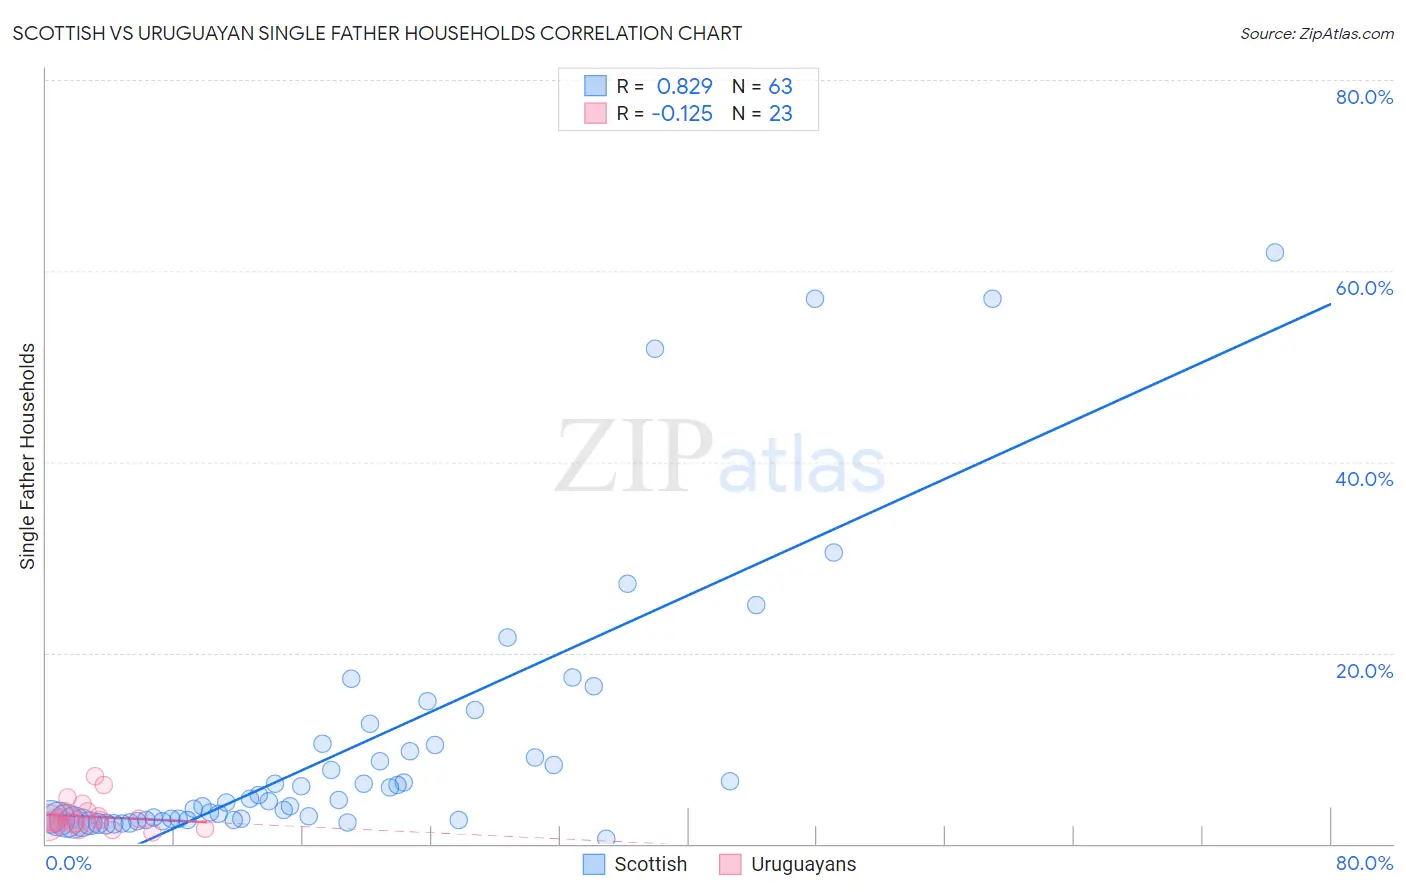
Scottish vs Uruguayan Single Father Households Correlation Chart
The statistical analysis conducted on geographies consisting of 551,948,135 people shows a very strong positive correlation between the proportion of Scottish and percentage of single father households in the United States with a correlation coefficient (R) of 0.829 and weighted average of 2.3%. Similarly, the statistical analysis conducted on geographies consisting of 144,465,475 people shows a poor negative correlation between the proportion of Uruguayans and percentage of single father households in the United States with a correlation coefficient (R) of -0.125 and weighted average of 2.4%, a difference of 3.5%.
Single Father Households Correlation Summary
| Measurement | Scottish | Uruguayan |
| Minimum | 0.58% | 1.1% |
| Maximum | 61.9% | 7.1% |
| Range | 61.3% | 5.9% |
| Mean | 10.1% | 2.9% |
| Median | 4.4% | 2.4% |
| Interquartile 25% (IQ1) | 2.5% | 2.0% |
| Interquartile 75% (IQ3) | 10.3% | 3.4% |
| Interquartile Range (IQR) | 7.8% | 1.3% |
| Standard Deviation (Sample) | 14.0% | 1.5% |
| Standard Deviation (Population) | 13.8% | 1.4% |
Similar Demographics by Single Father Households
Demographics Similar to Scottish by Single Father Households
In terms of single father households, the demographic groups most similar to Scottish are Swiss (2.3%, a difference of 0.030%), Irish (2.3%, a difference of 0.070%), Pakistani (2.3%, a difference of 0.21%), Scotch-Irish (2.3%, a difference of 0.31%), and Immigrants from Bolivia (2.3%, a difference of 0.34%).
| Demographics | Rating | Rank | Single Father Households |
| Europeans | 80.9 /100 | #155 | Excellent 2.3% |
| Immigrants | South America | 79.9 /100 | #156 | Good 2.3% |
| Canadians | 79.7 /100 | #157 | Good 2.3% |
| Immigrants | Senegal | 79.4 /100 | #158 | Good 2.3% |
| Immigrants | West Indies | 77.9 /100 | #159 | Good 2.3% |
| Immigrants | Bolivia | 76.3 /100 | #160 | Good 2.3% |
| Swiss | 73.2 /100 | #161 | Good 2.3% |
| Scottish | 72.8 /100 | #162 | Good 2.3% |
| Irish | 72.1 /100 | #163 | Good 2.3% |
| Pakistanis | 70.6 /100 | #164 | Good 2.3% |
| Scotch-Irish | 69.4 /100 | #165 | Good 2.3% |
| English | 68.6 /100 | #166 | Good 2.3% |
| South Americans | 64.3 /100 | #167 | Good 2.3% |
| Icelanders | 63.1 /100 | #168 | Good 2.3% |
| Czechs | 62.5 /100 | #169 | Good 2.3% |
Demographics Similar to Uruguayans by Single Father Households
In terms of single father households, the demographic groups most similar to Uruguayans are Immigrants from Sudan (2.4%, a difference of 0.010%), Panamanian (2.4%, a difference of 0.010%), Immigrants from Africa (2.4%, a difference of 0.030%), Immigrants from Philippines (2.4%, a difference of 0.090%), and Kenyan (2.4%, a difference of 0.14%).
| Demographics | Rating | Rank | Single Father Households |
| Immigrants | Bosnia and Herzegovina | 40.4 /100 | #186 | Average 2.4% |
| Immigrants | Colombia | 34.0 /100 | #187 | Fair 2.4% |
| Hmong | 33.0 /100 | #188 | Fair 2.4% |
| U.S. Virgin Islanders | 31.8 /100 | #189 | Fair 2.4% |
| French | 31.7 /100 | #190 | Fair 2.4% |
| Immigrants | Africa | 30.0 /100 | #191 | Fair 2.4% |
| Immigrants | Sudan | 29.8 /100 | #192 | Fair 2.4% |
| Uruguayans | 29.7 /100 | #193 | Fair 2.4% |
| Panamanians | 29.6 /100 | #194 | Fair 2.4% |
| Immigrants | Philippines | 28.7 /100 | #195 | Fair 2.4% |
| Kenyans | 28.0 /100 | #196 | Fair 2.4% |
| Germans | 28.0 /100 | #197 | Fair 2.4% |
| Scandinavians | 27.4 /100 | #198 | Fair 2.4% |
| Immigrants | Vietnam | 27.1 /100 | #199 | Fair 2.4% |
| Peruvians | 27.1 /100 | #200 | Fair 2.4% |