Scottish vs Cherokee Associate's Degree
COMPARE
Scottish
Cherokee
Associate's Degree
Associate's Degree Comparison
Scottish
Cherokee
46.9%
ASSOCIATE'S DEGREE
65.4/ 100
METRIC RATING
160th/ 347
METRIC RANK
38.9%
ASSOCIATE'S DEGREE
0.0/ 100
METRIC RATING
296th/ 347
METRIC RANK
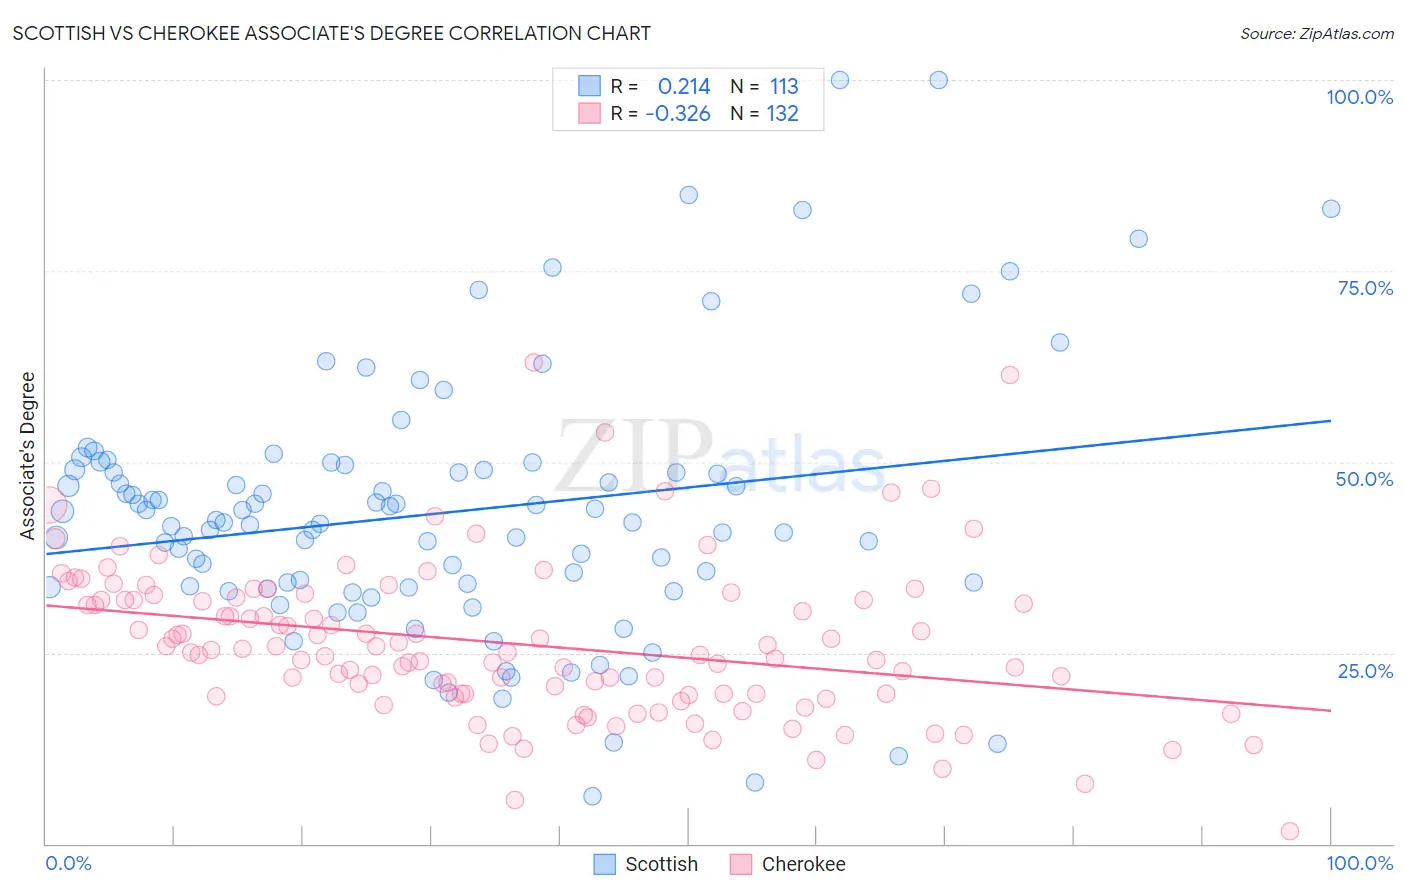
Scottish vs Cherokee Associate's Degree Correlation Chart
The statistical analysis conducted on geographies consisting of 567,065,260 people shows a weak positive correlation between the proportion of Scottish and percentage of population with at least associate's degree education in the United States with a correlation coefficient (R) of 0.214 and weighted average of 46.9%. Similarly, the statistical analysis conducted on geographies consisting of 493,690,336 people shows a mild negative correlation between the proportion of Cherokee and percentage of population with at least associate's degree education in the United States with a correlation coefficient (R) of -0.326 and weighted average of 38.9%, a difference of 20.7%.
Associate's Degree Correlation Summary
| Measurement | Scottish | Cherokee |
| Minimum | 6.2% | 1.6% |
| Maximum | 100.0% | 63.1% |
| Range | 93.7% | 61.4% |
| Mean | 43.3% | 26.2% |
| Median | 42.0% | 25.3% |
| Interquartile 25% (IQ1) | 33.6% | 19.6% |
| Interquartile 75% (IQ3) | 49.0% | 31.9% |
| Interquartile Range (IQR) | 15.4% | 12.3% |
| Standard Deviation (Sample) | 17.2% | 10.0% |
| Standard Deviation (Population) | 17.1% | 10.0% |
Similar Demographics by Associate's Degree
Demographics Similar to Scottish by Associate's Degree
In terms of associate's degree, the demographic groups most similar to Scottish are Scandinavian (46.9%, a difference of 0.020%), Immigrants from Africa (46.8%, a difference of 0.18%), Somali (46.8%, a difference of 0.23%), Colombian (46.8%, a difference of 0.24%), and Immigrants from Poland (47.1%, a difference of 0.31%).
| Demographics | Rating | Rank | Associate's Degree |
| Czechs | 72.2 /100 | #153 | Good 47.2% |
| Immigrants | Kenya | 72.1 /100 | #154 | Good 47.2% |
| Kenyans | 70.6 /100 | #155 | Good 47.1% |
| South Americans | 70.5 /100 | #156 | Good 47.1% |
| Sudanese | 70.3 /100 | #157 | Good 47.1% |
| Immigrants | Germany | 69.7 /100 | #158 | Good 47.1% |
| Immigrants | Poland | 69.2 /100 | #159 | Good 47.1% |
| Scottish | 65.4 /100 | #160 | Good 46.9% |
| Scandinavians | 65.2 /100 | #161 | Good 46.9% |
| Immigrants | Africa | 63.2 /100 | #162 | Good 46.8% |
| Somalis | 62.5 /100 | #163 | Good 46.8% |
| Colombians | 62.4 /100 | #164 | Good 46.8% |
| Immigrants | South America | 59.9 /100 | #165 | Average 46.7% |
| Hungarians | 59.3 /100 | #166 | Average 46.7% |
| Immigrants | Sierra Leone | 59.2 /100 | #167 | Average 46.7% |
Demographics Similar to Cherokee by Associate's Degree
In terms of associate's degree, the demographic groups most similar to Cherokee are Honduran (38.9%, a difference of 0.17%), Cape Verdean (38.8%, a difference of 0.28%), Nepalese (39.0%, a difference of 0.46%), Salvadoran (39.0%, a difference of 0.46%), and Cheyenne (38.7%, a difference of 0.55%).
| Demographics | Rating | Rank | Associate's Degree |
| Central Americans | 0.0 /100 | #289 | Tragic 39.4% |
| Immigrants | Haiti | 0.0 /100 | #290 | Tragic 39.3% |
| Dominicans | 0.0 /100 | #291 | Tragic 39.3% |
| Blacks/African Americans | 0.0 /100 | #292 | Tragic 39.1% |
| Nepalese | 0.0 /100 | #293 | Tragic 39.0% |
| Salvadorans | 0.0 /100 | #294 | Tragic 39.0% |
| Hondurans | 0.0 /100 | #295 | Tragic 38.9% |
| Cherokee | 0.0 /100 | #296 | Tragic 38.9% |
| Cape Verdeans | 0.0 /100 | #297 | Tragic 38.8% |
| Cheyenne | 0.0 /100 | #298 | Tragic 38.7% |
| Ute | 0.0 /100 | #299 | Tragic 38.6% |
| Chickasaw | 0.0 /100 | #300 | Tragic 38.6% |
| Tsimshian | 0.0 /100 | #301 | Tragic 38.6% |
| Colville | 0.0 /100 | #302 | Tragic 38.5% |
| Guatemalans | 0.0 /100 | #303 | Tragic 38.5% |