Immigrants from Austria vs Cherokee Currently Married
COMPARE
Immigrants from Austria
Cherokee
Currently Married
Currently Married Comparison
Immigrants from Austria
Cherokee
48.5%
CURRENTLY MARRIED
98.8/ 100
METRIC RATING
53rd/ 347
METRIC RANK
46.9%
CURRENTLY MARRIED
66.8/ 100
METRIC RATING
158th/ 347
METRIC RANK
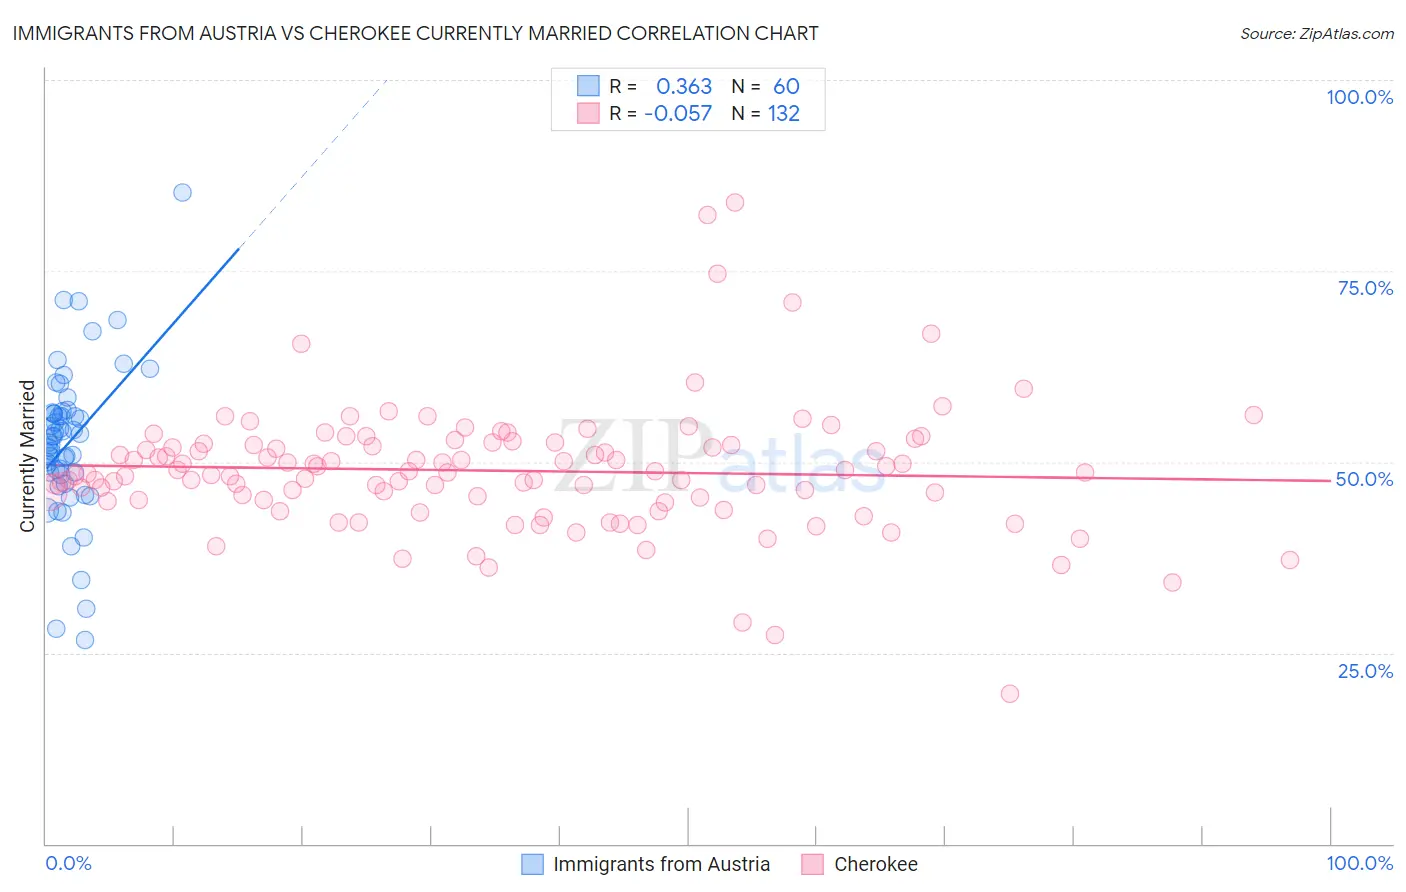
Immigrants from Austria vs Cherokee Currently Married Correlation Chart
The statistical analysis conducted on geographies consisting of 167,972,759 people shows a mild positive correlation between the proportion of Immigrants from Austria and percentage of population currently married in the United States with a correlation coefficient (R) of 0.363 and weighted average of 48.5%. Similarly, the statistical analysis conducted on geographies consisting of 493,651,185 people shows a slight negative correlation between the proportion of Cherokee and percentage of population currently married in the United States with a correlation coefficient (R) of -0.057 and weighted average of 46.9%, a difference of 3.4%.
Currently Married Correlation Summary
| Measurement | Immigrants from Austria | Cherokee |
| Minimum | 26.6% | 19.6% |
| Maximum | 85.3% | 84.0% |
| Range | 58.7% | 64.4% |
| Mean | 52.5% | 48.8% |
| Median | 52.9% | 48.6% |
| Interquartile 25% (IQ1) | 48.4% | 45.0% |
| Interquartile 75% (IQ3) | 56.4% | 52.3% |
| Interquartile Range (IQR) | 8.0% | 7.4% |
| Standard Deviation (Sample) | 10.0% | 8.4% |
| Standard Deviation (Population) | 9.9% | 8.4% |
Similar Demographics by Currently Married
Demographics Similar to Immigrants from Austria by Currently Married
In terms of currently married, the demographic groups most similar to Immigrants from Austria are Immigrants from Moldova (48.5%, a difference of 0.060%), Immigrants from North Macedonia (48.5%, a difference of 0.070%), Latvian (48.5%, a difference of 0.070%), Immigrants from Netherlands (48.5%, a difference of 0.10%), and Russian (48.6%, a difference of 0.12%).
| Demographics | Rating | Rank | Currently Married |
| Immigrants | Iran | 99.2 /100 | #46 | Exceptional 48.7% |
| Northern Europeans | 99.2 /100 | #47 | Exceptional 48.7% |
| Austrians | 99.2 /100 | #48 | Exceptional 48.7% |
| Bhutanese | 99.1 /100 | #49 | Exceptional 48.6% |
| Iranians | 99.0 /100 | #50 | Exceptional 48.6% |
| Whites/Caucasians | 99.0 /100 | #51 | Exceptional 48.6% |
| Russians | 98.9 /100 | #52 | Exceptional 48.6% |
| Immigrants | Austria | 98.8 /100 | #53 | Exceptional 48.5% |
| Immigrants | Moldova | 98.7 /100 | #54 | Exceptional 48.5% |
| Immigrants | North Macedonia | 98.7 /100 | #55 | Exceptional 48.5% |
| Latvians | 98.7 /100 | #56 | Exceptional 48.5% |
| Immigrants | Netherlands | 98.6 /100 | #57 | Exceptional 48.5% |
| French | 98.6 /100 | #58 | Exceptional 48.4% |
| Immigrants | Ireland | 98.5 /100 | #59 | Exceptional 48.4% |
| Immigrants | Romania | 98.5 /100 | #60 | Exceptional 48.4% |
Demographics Similar to Cherokee by Currently Married
In terms of currently married, the demographic groups most similar to Cherokee are Iraqi (46.9%, a difference of 0.020%), Immigrants from Uzbekistan (46.9%, a difference of 0.030%), Immigrants from Southern Europe (46.9%, a difference of 0.030%), Immigrants from Switzerland (46.9%, a difference of 0.040%), and Spanish (47.0%, a difference of 0.050%).
| Demographics | Rating | Rank | Currently Married |
| Chileans | 69.8 /100 | #151 | Good 47.0% |
| Immigrants | Serbia | 68.8 /100 | #152 | Good 47.0% |
| Immigrants | Venezuela | 68.6 /100 | #153 | Good 47.0% |
| Albanians | 68.6 /100 | #154 | Good 47.0% |
| Arabs | 68.6 /100 | #155 | Good 47.0% |
| Spanish | 68.1 /100 | #156 | Good 47.0% |
| Immigrants | Switzerland | 67.8 /100 | #157 | Good 46.9% |
| Cherokee | 66.8 /100 | #158 | Good 46.9% |
| Iraqis | 66.4 /100 | #159 | Good 46.9% |
| Immigrants | Uzbekistan | 66.0 /100 | #160 | Good 46.9% |
| Immigrants | Southern Europe | 65.9 /100 | #161 | Good 46.9% |
| Immigrants | Nonimmigrants | 65.4 /100 | #162 | Good 46.9% |
| Delaware | 64.7 /100 | #163 | Good 46.9% |
| Immigrants | Western Asia | 64.2 /100 | #164 | Good 46.9% |
| Samoans | 59.8 /100 | #165 | Average 46.8% |