Scandinavian vs Maltese In Labor Force | Age 45-54
COMPARE
Scandinavian
Maltese
In Labor Force | Age 45-54
In Labor Force | Age 45-54 Comparison
Scandinavians
Maltese
83.0%
IN LABOR FORCE | AGE 45-54
78.5/ 100
METRIC RATING
139th/ 347
METRIC RANK
83.3%
IN LABOR FORCE | AGE 45-54
94.4/ 100
METRIC RATING
98th/ 347
METRIC RANK
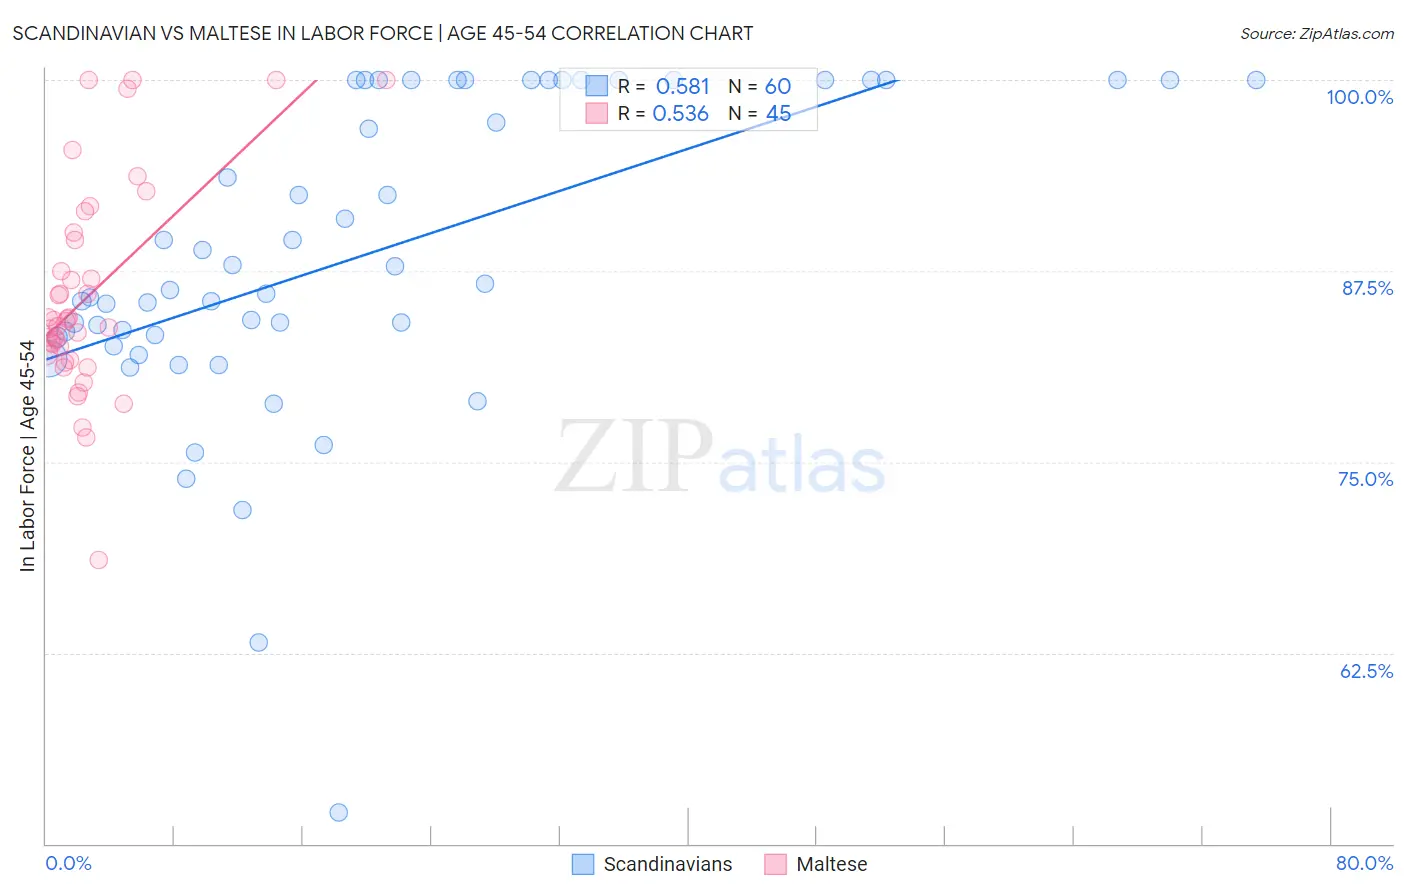
Scandinavian vs Maltese In Labor Force | Age 45-54 Correlation Chart
The statistical analysis conducted on geographies consisting of 472,233,572 people shows a substantial positive correlation between the proportion of Scandinavians and labor force participation rate among population between the ages 45 and 54 in the United States with a correlation coefficient (R) of 0.581 and weighted average of 83.0%. Similarly, the statistical analysis conducted on geographies consisting of 126,435,946 people shows a substantial positive correlation between the proportion of Maltese and labor force participation rate among population between the ages 45 and 54 in the United States with a correlation coefficient (R) of 0.536 and weighted average of 83.3%, a difference of 0.34%.
In Labor Force | Age 45-54 Correlation Summary
| Measurement | Scandinavian | Maltese |
| Minimum | 52.0% | 68.6% |
| Maximum | 100.0% | 100.0% |
| Range | 48.0% | 31.4% |
| Mean | 88.5% | 85.9% |
| Median | 86.5% | 84.2% |
| Interquartile 25% (IQ1) | 83.3% | 81.9% |
| Interquartile 75% (IQ3) | 100.0% | 89.8% |
| Interquartile Range (IQR) | 16.7% | 7.9% |
| Standard Deviation (Sample) | 10.2% | 6.9% |
| Standard Deviation (Population) | 10.1% | 6.8% |
Similar Demographics by In Labor Force | Age 45-54
Demographics Similar to Scandinavians by In Labor Force | Age 45-54
In terms of in labor force | age 45-54, the demographic groups most similar to Scandinavians are Yugoslavian (83.0%, a difference of 0.0%), Ghanaian (83.0%, a difference of 0.010%), Immigrants from Haiti (83.0%, a difference of 0.010%), Immigrants from Scotland (83.0%, a difference of 0.010%), and Okinawan (83.0%, a difference of 0.020%).
| Demographics | Rating | Rank | In Labor Force | Age 45-54 |
| Immigrants | Ukraine | 82.9 /100 | #132 | Excellent 83.0% |
| Liberians | 82.7 /100 | #133 | Excellent 83.0% |
| Sudanese | 82.0 /100 | #134 | Excellent 83.0% |
| Austrians | 81.3 /100 | #135 | Excellent 83.0% |
| Immigrants | Kazakhstan | 81.0 /100 | #136 | Excellent 83.0% |
| Immigrants | Spain | 80.4 /100 | #137 | Excellent 83.0% |
| Ghanaians | 79.5 /100 | #138 | Good 83.0% |
| Scandinavians | 78.5 /100 | #139 | Good 83.0% |
| Yugoslavians | 78.3 /100 | #140 | Good 83.0% |
| Immigrants | Haiti | 77.9 /100 | #141 | Good 83.0% |
| Immigrants | Scotland | 77.8 /100 | #142 | Good 83.0% |
| Okinawans | 77.0 /100 | #143 | Good 83.0% |
| Soviet Union | 76.8 /100 | #144 | Good 83.0% |
| Romanians | 75.4 /100 | #145 | Good 83.0% |
| Immigrants | France | 75.3 /100 | #146 | Good 83.0% |
Demographics Similar to Maltese by In Labor Force | Age 45-54
In terms of in labor force | age 45-54, the demographic groups most similar to Maltese are Palestinian (83.3%, a difference of 0.010%), Immigrants from Middle Africa (83.3%, a difference of 0.010%), Mongolian (83.3%, a difference of 0.010%), Immigrants from Belarus (83.3%, a difference of 0.010%), and Argentinean (83.3%, a difference of 0.020%).
| Demographics | Rating | Rank | In Labor Force | Age 45-54 |
| South Americans | 95.5 /100 | #91 | Exceptional 83.3% |
| Danes | 95.3 /100 | #92 | Exceptional 83.3% |
| Italians | 95.1 /100 | #93 | Exceptional 83.3% |
| Argentineans | 94.9 /100 | #94 | Exceptional 83.3% |
| Immigrants | Argentina | 94.9 /100 | #95 | Exceptional 83.3% |
| Immigrants | Kuwait | 94.8 /100 | #96 | Exceptional 83.3% |
| Palestinians | 94.8 /100 | #97 | Exceptional 83.3% |
| Maltese | 94.4 /100 | #98 | Exceptional 83.3% |
| Immigrants | Middle Africa | 94.3 /100 | #99 | Exceptional 83.3% |
| Mongolians | 94.2 /100 | #100 | Exceptional 83.3% |
| Immigrants | Belarus | 94.1 /100 | #101 | Exceptional 83.3% |
| Immigrants | Singapore | 93.9 /100 | #102 | Exceptional 83.3% |
| Albanians | 93.9 /100 | #103 | Exceptional 83.3% |
| Immigrants | Romania | 93.8 /100 | #104 | Exceptional 83.3% |
| Immigrants | South America | 93.5 /100 | #105 | Exceptional 83.2% |