Scandinavian vs Immigrants from Ukraine No Schooling Completed

COMPARE

Scandinavian
Race
Ancestry
AfghanAfricanAlaska NativeAlaskan AthabascanAlbanianAleutAlsatianAmericanApacheArabArapahoArgentineanArmenianAssyrian/Chaldean/SyriacAustralianAustrianBahamianBangladeshiBarbadianBasqueBelgianBelizeanBermudanBhutaneseBlackfeetBolivianBrazilianBritishBritish West IndianBulgarianBurmeseCajunCambodianCanadianCape VerdeanCarpatho RusynCelticCentral AmericanCentral American IndianCherokeeCheyenneChickasawChileanChineseChippewaChoctawColombianColvilleComancheCosta RicanCreeCreekCroatianCrowCubanCypriotCzechCzechoslovakianDanishDelawareDominicanDutchDutch West IndianEastern EuropeanEcuadorianEgyptianEnglishEstonianEthiopianEuropeanFijianFilipinoFinnishFrenchFrench American IndianFrench CanadianGermanGerman RussianGhanaianGreekGuamanian/ChamorroGuatemalanGuyaneseHaitianHmongHonduranHopiHoumaHungarianIcelanderIndian (Asian)IndonesianInupiatIranianIraqiIrishIroquoisIsraeliItalianJamaicanJapaneseJordanianKenyanKiowaKoreanLaotianLatvianLebaneseLiberianLithuanianLumbeeLuxembourgerMacedonianMalaysianMalteseMarshalleseMenomineeMexicanMexican American IndianMongolianMoroccanNative HawaiianNavajoNepaleseNew ZealanderNicaraguanNigerianNorthern EuropeanNorwegianOkinawanOsageOttawaPaiutePakistaniPalestinianPanamanianParaguayanPennsylvania GermanPeruvianPimaPolishPortuguesePotawatomiPuebloPuerto RicanPuget Sound SalishRomanianRussianSalvadoranSamoanScandinavianScotch-IrishScottishSeminoleSenegaleseSerbianShoshoneSierra LeoneanSiouxSlavicSlovakSloveneSomaliSouth AfricanSouth AmericanSouth American IndianSoviet UnionSpaniardSpanishSpanish AmericanSpanish American IndianSri LankanSubsaharan AfricanSudaneseSwedishSwissSyrianTaiwaneseThaiTlingit-HaidaTohono O'OdhamTonganTrinidadian and TobagonianTsimshianTurkishU.S. Virgin IslanderUgandanUkrainianUruguayanUteVenezuelanVietnameseWelshWest IndianYakamaYaquiYugoslavianYumanYup'ikZimbabwean
Immigration
NonimmigrantsImmigrantsAfghanistanAfricaAlbaniaArgentinaArmeniaAsiaAustraliaAustriaBahamasBangladeshBarbadosBelarusBelgiumBelizeBoliviaBosnia and HerzegovinaBrazilBulgariaBurma/MyanmarCabo VerdeCambodiaCameroonCanadaCaribbeanCentral AmericaChileChinaColombiaCongoCosta RicaCroatiaCubaCzechoslovakiaDenmarkDominicaDominican RepublicEastern AfricaEastern AsiaEastern EuropeEcuadorEgyptEl SalvadorEnglandEritreaEthiopiaEuropeFijiFranceGermanyGhanaGreeceGrenadaGuatemalaGuyanaHaitiHondurasHong KongHungaryIndiaIndonesiaIranIraqIrelandIsraelItalyJamaicaJapanJordanKazakhstanKenyaKoreaKuwaitLaosLatin AmericaLatviaLebanonLiberiaLithuaniaMalaysiaMexicoMicronesiaMiddle AfricaMoldovaMoroccoNepalNetherlandsNicaraguaNigeriaNorth AmericaNorth MacedoniaNorthern AfricaNorthern EuropeNorwayOceaniaPakistanPanamaPeruPhilippinesPolandPortugalRomaniaRussiaSaudi ArabiaScotlandSenegalSerbiaSierra LeoneSingaporeSomaliaSouth AfricaSouth AmericaSouth Central AsiaSouth Eastern AsiaSouthern EuropeSpainSri LankaSt. Vincent and the GrenadinesSudanSwedenSwitzerlandSyriaTaiwanThailandTrinidad and TobagoTurkeyUgandaUruguayUzbekistanVenezuelaVietnamWest IndiesWestern AfricaWestern AsiaWestern EuropeYemenZaireZimbabweAzores
Immigrants from Ukraine
Race
Ancestry
AfghanAfricanAlaska NativeAlaskan AthabascanAlbanianAleutAlsatianAmericanApacheArabArapahoArgentineanArmenianAssyrian/Chaldean/SyriacAustralianAustrianBahamianBangladeshiBarbadianBasqueBelgianBelizeanBermudanBhutaneseBlackfeetBolivianBrazilianBritishBritish West IndianBulgarianBurmeseCajunCambodianCanadianCape VerdeanCarpatho RusynCelticCentral AmericanCentral American IndianCherokeeCheyenneChickasawChileanChineseChippewaChoctawColombianColvilleComancheCosta RicanCreeCreekCroatianCrowCubanCypriotCzechCzechoslovakianDanishDelawareDominicanDutchDutch West IndianEastern EuropeanEcuadorianEgyptianEnglishEstonianEthiopianEuropeanFijianFilipinoFinnishFrenchFrench American IndianFrench CanadianGermanGerman RussianGhanaianGreekGuamanian/ChamorroGuatemalanGuyaneseHaitianHmongHonduranHopiHoumaHungarianIcelanderIndian (Asian)IndonesianInupiatIranianIraqiIrishIroquoisIsraeliItalianJamaicanJapaneseJordanianKenyanKiowaKoreanLaotianLatvianLebaneseLiberianLithuanianLumbeeLuxembourgerMacedonianMalaysianMalteseMarshalleseMenomineeMexicanMexican American IndianMongolianMoroccanNative HawaiianNavajoNepaleseNew ZealanderNicaraguanNigerianNorthern EuropeanNorwegianOkinawanOsageOttawaPaiutePakistaniPalestinianPanamanianParaguayanPennsylvania GermanPeruvianPimaPolishPortuguesePotawatomiPuebloPuerto RicanPuget Sound SalishRomanianRussianSalvadoranSamoanScotch-IrishScottishSeminoleSenegaleseSerbianShoshoneSierra LeoneanSiouxSlavicSlovakSloveneSomaliSouth AfricanSouth AmericanSouth American IndianSoviet UnionSpaniardSpanishSpanish AmericanSpanish American IndianSri LankanSubsaharan AfricanSudaneseSwedishSwissSyrianTaiwaneseThaiTlingit-HaidaTohono O'OdhamTonganTrinidadian and TobagonianTsimshianTurkishU.S. Virgin IslanderUgandanUkrainianUruguayanUteVenezuelanVietnameseWelshWest IndianYakamaYaquiYugoslavianYumanYup'ikZimbabwean
Immigration
NonimmigrantsImmigrantsAfghanistanAfricaAlbaniaArgentinaArmeniaAsiaAustraliaAustriaBahamasBangladeshBarbadosBelarusBelgiumBelizeBoliviaBosnia and HerzegovinaBrazilBulgariaBurma/MyanmarCabo VerdeCambodiaCameroonCanadaCaribbeanCentral AmericaChileChinaColombiaCongoCosta RicaCroatiaCubaCzechoslovakiaDenmarkDominicaDominican RepublicEastern AfricaEastern AsiaEastern EuropeEcuadorEgyptEl SalvadorEnglandEritreaEthiopiaEuropeFijiFranceGermanyGhanaGreeceGrenadaGuatemalaGuyanaHaitiHondurasHong KongHungaryIndiaIndonesiaIranIraqIrelandIsraelItalyJamaicaJapanJordanKazakhstanKenyaKoreaKuwaitLaosLatin AmericaLatviaLebanonLiberiaLithuaniaMalaysiaMexicoMicronesiaMiddle AfricaMoldovaMoroccoNepalNetherlandsNicaraguaNigeriaNorth AmericaNorth MacedoniaNorthern AfricaNorthern EuropeNorwayOceaniaPakistanPanamaPeruPhilippinesPolandPortugalRomaniaRussiaSaudi ArabiaScotlandSenegalSerbiaSierra LeoneSingaporeSomaliaSouth AfricaSouth AmericaSouth Central AsiaSouth Eastern AsiaSouthern EuropeSpainSri LankaSt. Vincent and the GrenadinesSudanSwedenSwitzerlandSyriaTaiwanThailandTrinidad and TobagoTurkeyUgandaUkraineUruguayUzbekistanVenezuelaVietnamWest IndiesWestern AfricaWestern AsiaWestern EuropeYemenZaireZimbabweAzores
No Schooling Completed
Income
Poverty
Unemployment
Labor Participation
Family Structure
Vehicle Availability
Education Level
Disability

No Schooling Completed Comparison

Scandinavians

Immigrants from Ukraine

Exceptional
Fair
1.5%
NO SCHOOLING COMPLETED
100.0/ 100
METRIC RATING
27th/ 347
METRIC RANK
2.2%
NO SCHOOLING COMPLETED
26.1/ 100
METRIC RATING
196th/ 347
METRIC RANK

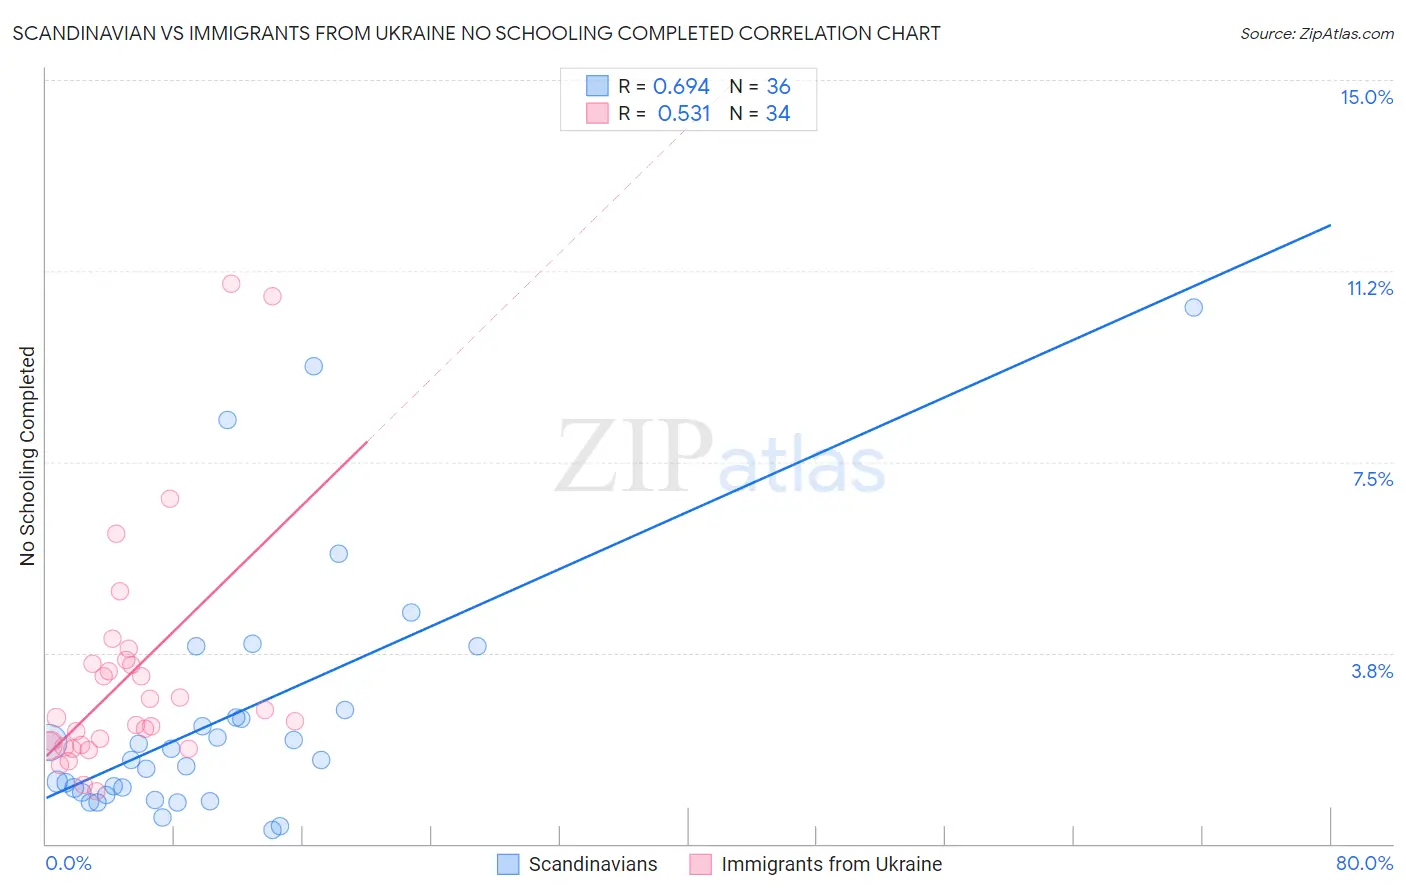
Scandinavian vs Immigrants from Ukraine No Schooling Completed Correlation Chart

The statistical analysis conducted on geographies consisting of 462,495,529 people shows a significant positive correlation between the proportion of Scandinavians and percentage of population with no schooling in the United States with a correlation coefficient (R) of 0.694 and weighted average of 1.5%. Similarly, the statistical analysis conducted on geographies consisting of 287,112,506 people shows a substantial positive correlation between the proportion of Immigrants from Ukraine and percentage of population with no schooling in the United States with a correlation coefficient (R) of 0.531 and weighted average of 2.2%, a difference of 44.3%.
Scandinavian vs Immigrants from Ukraine No Schooling Completed

No Schooling Completed Correlation Summary

MeasurementScandinavianImmigrants from Ukraine
Minimum0.27%1.0%
Maximum10.5%11.0%
Range10.3%9.9%
Mean2.5%3.3%
Median1.6%2.4%
Interquartile 25% (IQ1)0.98%1.9%
Interquartile 75% (IQ3)2.6%3.5%
Interquartile Range (IQR)1.6%1.6%
Standard Deviation (Sample)2.5%2.3%
Standard Deviation (Population)2.4%2.3%

Similar Demographics by No Schooling Completed

Demographics Similar to Scandinavians by No Schooling Completed

In terms of no schooling completed, the demographic groups most similar to Scandinavians are French Canadian (1.5%, a difference of 0.010%), Czech (1.5%, a difference of 0.53%), Lumbee (1.5%, a difference of 0.92%), French (1.5%, a difference of 1.1%), and Pennsylvania German (1.5%, a difference of 1.1%).
DemographicsRating | RankNo Schooling Completed
Welsh
100.0
/100
|
#20
Exceptional
1.5%
Chinese
100.0
/100
|
#21
Exceptional
1.5%
Alaska Natives
100.0
/100
|
#22
Exceptional
1.5%
Europeans
100.0
/100
|
#23
Exceptional
1.5%
Pennsylvania Germans
100.0
/100
|
#24
Exceptional
1.5%
French
100.0
/100
|
#25
Exceptional
1.5%
Czechs
100.0
/100
|
#26
Exceptional
1.5%
Scandinavians
100.0
/100
|
#27
Exceptional
1.5%
French Canadians
100.0
/100
|
#28
Exceptional
1.5%
Lumbee
100.0
/100
|
#29
Exceptional
1.5%
British
100.0
/100
|
#30
Exceptional
1.5%
Inupiat
100.0
/100
|
#31
Exceptional
1.5%
Swiss
100.0
/100
|
#32
Exceptional
1.5%
Italians
100.0
/100
|
#33
Exceptional
1.5%
Latvians
100.0
/100
|
#34
Exceptional
1.5%

Demographics Similar to Immigrants from Ukraine by No Schooling Completed

In terms of no schooling completed, the demographic groups most similar to Immigrants from Ukraine are Hawaiian (2.2%, a difference of 0.15%), Immigrants from Albania (2.2%, a difference of 0.35%), Immigrants from Southern Europe (2.2%, a difference of 0.41%), Paraguayan (2.2%, a difference of 0.52%), and Guamanian/Chamorro (2.2%, a difference of 0.59%).
DemographicsRating | RankNo Schooling Completed
Immigrants | Egypt
36.1
/100
|
#189
Fair
2.1%
Spanish Americans
32.6
/100
|
#190
Fair
2.1%
Bermudans
30.7
/100
|
#191
Fair
2.1%
Guamanians/Chamorros
29.8
/100
|
#192
Fair
2.2%
Paraguayans
29.3
/100
|
#193
Fair
2.2%
Immigrants | Albania
28.3
/100
|
#194
Fair
2.2%
Hawaiians
27.0
/100
|
#195
Fair
2.2%
Immigrants | Ukraine
26.1
/100
|
#196
Fair
2.2%
Immigrants | Southern Europe
23.8
/100
|
#197
Fair
2.2%
Immigrants | Chile
22.7
/100
|
#198
Fair
2.2%
Africans
21.8
/100
|
#199
Fair
2.2%
Immigrants | Northern Africa
19.5
/100
|
#200
Poor
2.2%
Costa Ricans
17.1
/100
|
#201
Poor
2.2%
Moroccans
13.7
/100
|
#202
Poor
2.2%
Laotians
13.3
/100
|
#203
Poor
2.2%