Scandinavian vs Bolivian Currently Married
COMPARE
Scandinavian
Bolivian
Currently Married
Currently Married Comparison
Scandinavians
Bolivians
49.5%
CURRENTLY MARRIED
99.9/ 100
METRIC RATING
17th/ 347
METRIC RANK
48.1%
CURRENTLY MARRIED
96.9/ 100
METRIC RATING
83rd/ 347
METRIC RANK
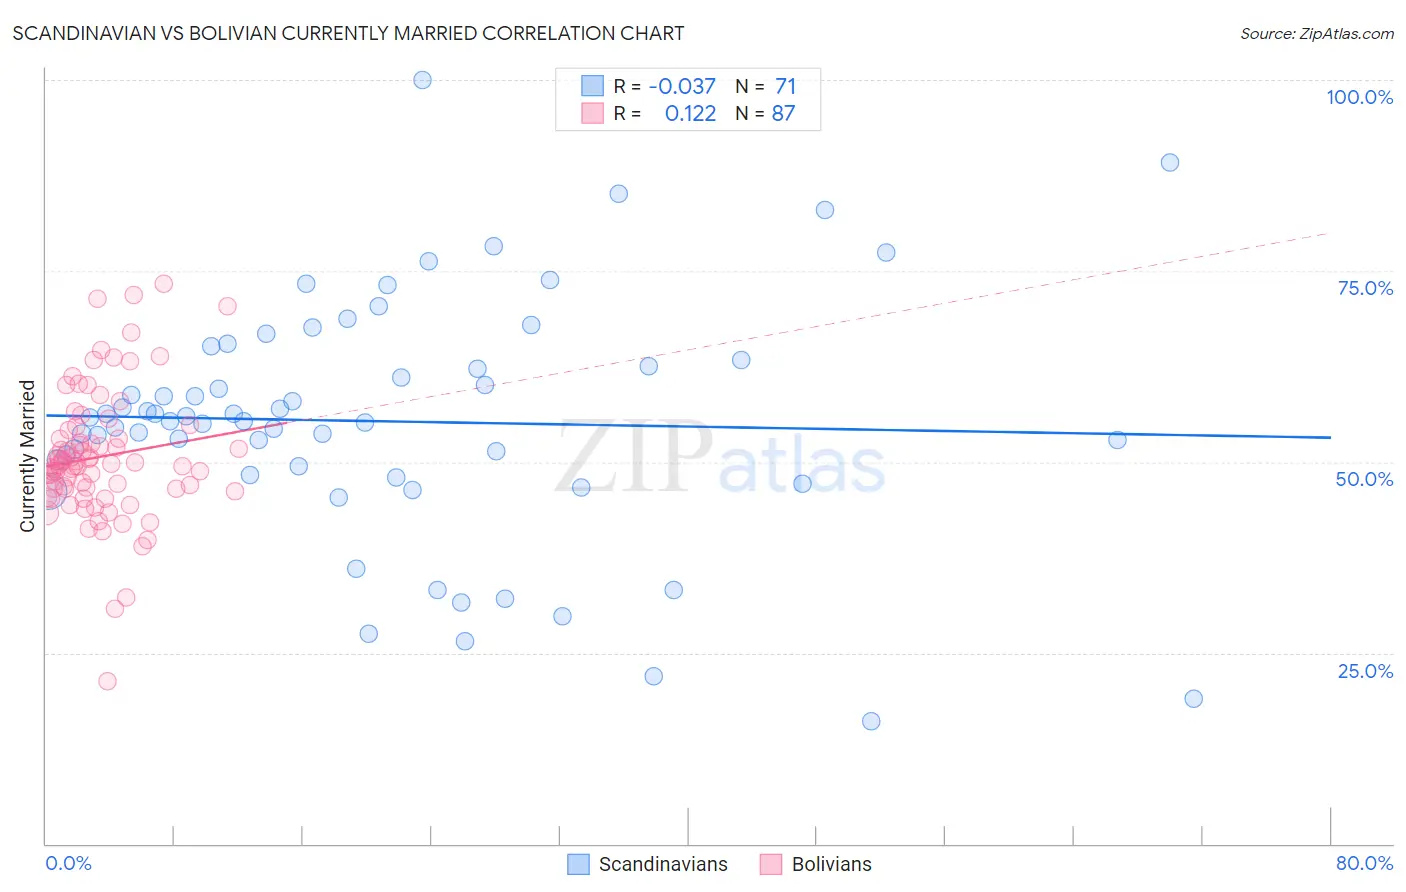
Scandinavian vs Bolivian Currently Married Correlation Chart
The statistical analysis conducted on geographies consisting of 472,583,978 people shows no correlation between the proportion of Scandinavians and percentage of population currently married in the United States with a correlation coefficient (R) of -0.037 and weighted average of 49.5%. Similarly, the statistical analysis conducted on geographies consisting of 184,673,558 people shows a poor positive correlation between the proportion of Bolivians and percentage of population currently married in the United States with a correlation coefficient (R) of 0.122 and weighted average of 48.1%, a difference of 2.9%.
Currently Married Correlation Summary
| Measurement | Scandinavian | Bolivian |
| Minimum | 16.0% | 21.3% |
| Maximum | 100.0% | 73.4% |
| Range | 84.0% | 52.1% |
| Mean | 55.3% | 50.7% |
| Median | 55.3% | 49.6% |
| Interquartile 25% (IQ1) | 48.3% | 46.4% |
| Interquartile 75% (IQ3) | 63.3% | 54.2% |
| Interquartile Range (IQR) | 15.0% | 7.8% |
| Standard Deviation (Sample) | 16.0% | 8.6% |
| Standard Deviation (Population) | 15.9% | 8.6% |
Similar Demographics by Currently Married
Demographics Similar to Scandinavians by Currently Married
In terms of currently married, the demographic groups most similar to Scandinavians are Chinese (49.5%, a difference of 0.020%), Pennsylvania German (49.6%, a difference of 0.16%), German (49.6%, a difference of 0.19%), Dutch (49.6%, a difference of 0.20%), and Immigrants from Scotland (49.3%, a difference of 0.29%).
| Demographics | Rating | Rank | Currently Married |
| Filipinos | 99.9 /100 | #10 | Exceptional 49.7% |
| English | 99.9 /100 | #11 | Exceptional 49.7% |
| Swiss | 99.9 /100 | #12 | Exceptional 49.7% |
| Dutch | 99.9 /100 | #13 | Exceptional 49.6% |
| Germans | 99.9 /100 | #14 | Exceptional 49.6% |
| Pennsylvania Germans | 99.9 /100 | #15 | Exceptional 49.6% |
| Chinese | 99.9 /100 | #16 | Exceptional 49.5% |
| Scandinavians | 99.9 /100 | #17 | Exceptional 49.5% |
| Immigrants | Scotland | 99.8 /100 | #18 | Exceptional 49.3% |
| Europeans | 99.8 /100 | #19 | Exceptional 49.3% |
| Luxembourgers | 99.8 /100 | #20 | Exceptional 49.3% |
| Scottish | 99.8 /100 | #21 | Exceptional 49.2% |
| Bulgarians | 99.7 /100 | #22 | Exceptional 49.1% |
| Immigrants | Pakistan | 99.7 /100 | #23 | Exceptional 49.1% |
| Lithuanians | 99.6 /100 | #24 | Exceptional 49.0% |
Demographics Similar to Bolivians by Currently Married
In terms of currently married, the demographic groups most similar to Bolivians are Immigrants from Israel (48.1%, a difference of 0.0%), Immigrants from Poland (48.1%, a difference of 0.010%), Immigrants from Sri Lanka (48.1%, a difference of 0.010%), Immigrants from Europe (48.1%, a difference of 0.010%), and Immigrants from South Africa (48.1%, a difference of 0.050%).
| Demographics | Rating | Rank | Currently Married |
| Basques | 97.2 /100 | #76 | Exceptional 48.1% |
| Slovenes | 97.1 /100 | #77 | Exceptional 48.1% |
| Immigrants | Belgium | 97.1 /100 | #78 | Exceptional 48.1% |
| Immigrants | South Africa | 97.0 /100 | #79 | Exceptional 48.1% |
| Immigrants | Poland | 96.9 /100 | #80 | Exceptional 48.1% |
| Immigrants | Sri Lanka | 96.9 /100 | #81 | Exceptional 48.1% |
| Immigrants | Europe | 96.9 /100 | #82 | Exceptional 48.1% |
| Bolivians | 96.9 /100 | #83 | Exceptional 48.1% |
| Immigrants | Israel | 96.9 /100 | #84 | Exceptional 48.1% |
| French Canadians | 96.3 /100 | #85 | Exceptional 48.0% |
| Immigrants | Japan | 96.2 /100 | #86 | Exceptional 48.0% |
| Jordanians | 96.2 /100 | #87 | Exceptional 48.0% |
| Immigrants | Eastern Europe | 96.1 /100 | #88 | Exceptional 48.0% |
| Indians (Asian) | 95.8 /100 | #89 | Exceptional 48.0% |
| Americans | 95.7 /100 | #90 | Exceptional 48.0% |