Immigrants from France vs Immigrants from Nicaragua Average Family Size
COMPARE
Immigrants from France
Immigrants from Nicaragua
Average Family Size
Average Family Size Comparison
Immigrants from France
Immigrants from Nicaragua
3.15
AVERAGE FAMILY SIZE
0.4/ 100
METRIC RATING
284th/ 347
METRIC RANK
3.37
AVERAGE FAMILY SIZE
100.0/ 100
METRIC RATING
48th/ 347
METRIC RANK
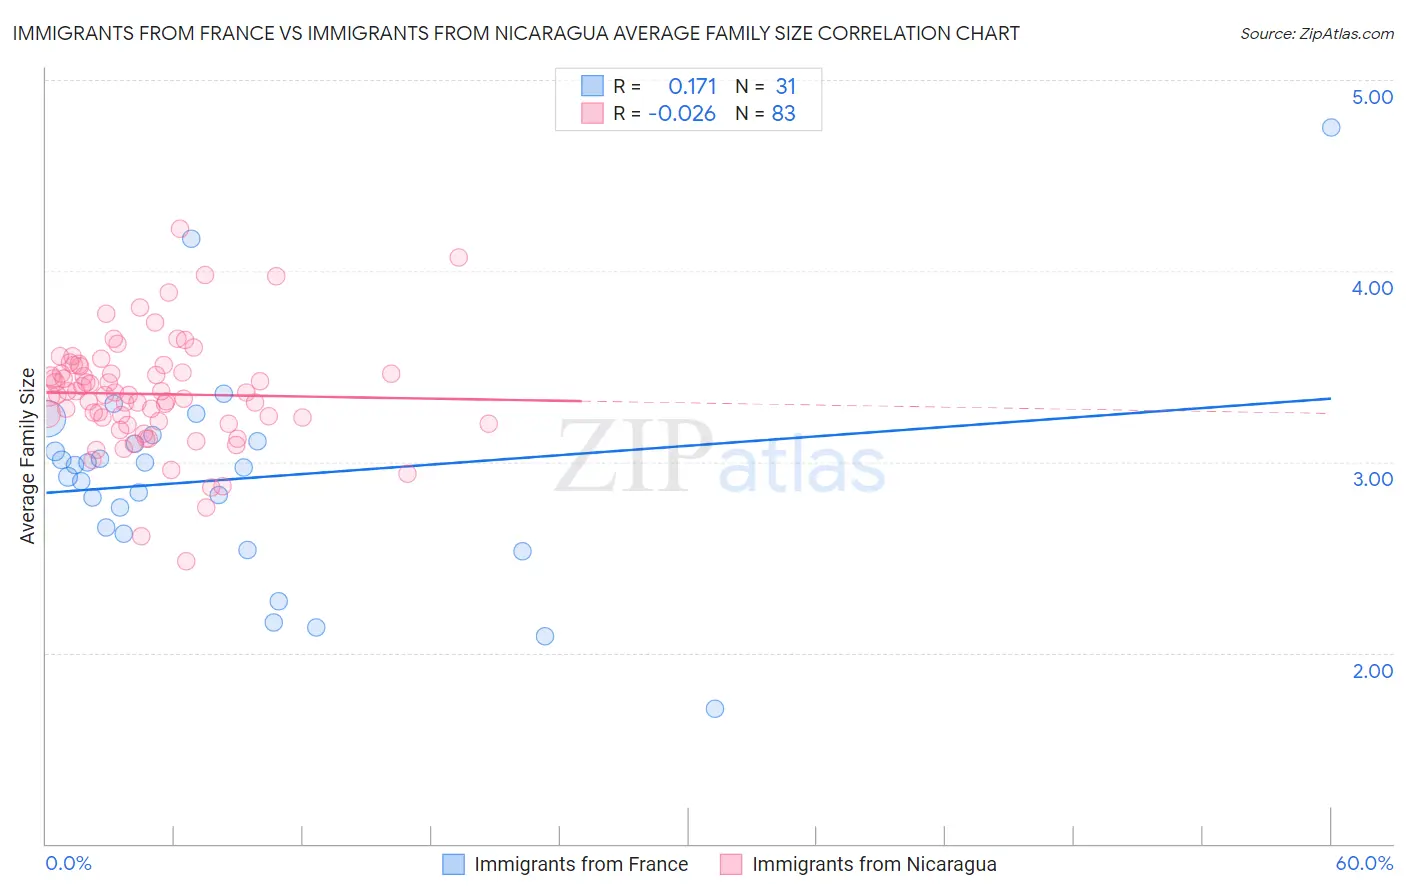
Immigrants from France vs Immigrants from Nicaragua Average Family Size Correlation Chart
The statistical analysis conducted on geographies consisting of 287,855,925 people shows a poor positive correlation between the proportion of Immigrants from France and average family size in the United States with a correlation coefficient (R) of 0.171 and weighted average of 3.15. Similarly, the statistical analysis conducted on geographies consisting of 236,326,320 people shows no correlation between the proportion of Immigrants from Nicaragua and average family size in the United States with a correlation coefficient (R) of -0.026 and weighted average of 3.37, a difference of 7.1%.
Average Family Size Correlation Summary
| Measurement | Immigrants from France | Immigrants from Nicaragua |
| Minimum | 1.71 | 2.48 |
| Maximum | 4.75 | 4.22 |
| Range | 3.04 | 1.74 |
| Mean | 2.91 | 3.36 |
| Median | 2.97 | 3.35 |
| Interquartile 25% (IQ1) | 2.63 | 3.20 |
| Interquartile 75% (IQ3) | 3.11 | 3.50 |
| Interquartile Range (IQR) | 0.48 | 0.30 |
| Standard Deviation (Sample) | 0.57 | 0.29 |
| Standard Deviation (Population) | 0.57 | 0.29 |
Similar Demographics by Average Family Size
Demographics Similar to Immigrants from France by Average Family Size
In terms of average family size, the demographic groups most similar to Immigrants from France are German Russian (3.15, a difference of 0.020%), Yugoslavian (3.15, a difference of 0.030%), Immigrants from Denmark (3.15, a difference of 0.040%), White/Caucasian (3.14, a difference of 0.050%), and Immigrants from England (3.15, a difference of 0.070%).
| Demographics | Rating | Rank | Average Family Size |
| Swiss | 0.5 /100 | #277 | Tragic 3.15 |
| Okinawans | 0.5 /100 | #278 | Tragic 3.15 |
| Immigrants | Europe | 0.5 /100 | #279 | Tragic 3.15 |
| Immigrants | England | 0.4 /100 | #280 | Tragic 3.15 |
| Immigrants | Denmark | 0.4 /100 | #281 | Tragic 3.15 |
| Yugoslavians | 0.4 /100 | #282 | Tragic 3.15 |
| German Russians | 0.4 /100 | #283 | Tragic 3.15 |
| Immigrants | France | 0.4 /100 | #284 | Tragic 3.15 |
| Whites/Caucasians | 0.3 /100 | #285 | Tragic 3.14 |
| Immigrants | Netherlands | 0.3 /100 | #286 | Tragic 3.14 |
| Greeks | 0.3 /100 | #287 | Tragic 3.14 |
| Immigrants | Czechoslovakia | 0.3 /100 | #288 | Tragic 3.14 |
| Immigrants | Norway | 0.3 /100 | #289 | Tragic 3.14 |
| Cypriots | 0.3 /100 | #290 | Tragic 3.14 |
| Alsatians | 0.2 /100 | #291 | Tragic 3.14 |
Demographics Similar to Immigrants from Nicaragua by Average Family Size
In terms of average family size, the demographic groups most similar to Immigrants from Nicaragua are Vietnamese (3.37, a difference of 0.0%), Haitian (3.37, a difference of 0.040%), Bangladeshi (3.37, a difference of 0.060%), Shoshone (3.37, a difference of 0.10%), and Alaska Native (3.37, a difference of 0.14%).
| Demographics | Rating | Rank | Average Family Size |
| Marshallese | 100.0 /100 | #41 | Exceptional 3.38 |
| Immigrants | Vietnam | 100.0 /100 | #42 | Exceptional 3.38 |
| Immigrants | Philippines | 100.0 /100 | #43 | Exceptional 3.37 |
| Alaska Natives | 100.0 /100 | #44 | Exceptional 3.37 |
| Shoshone | 100.0 /100 | #45 | Exceptional 3.37 |
| Haitians | 100.0 /100 | #46 | Exceptional 3.37 |
| Vietnamese | 100.0 /100 | #47 | Exceptional 3.37 |
| Immigrants | Nicaragua | 100.0 /100 | #48 | Exceptional 3.37 |
| Bangladeshis | 100.0 /100 | #49 | Exceptional 3.37 |
| Immigrants | Bangladesh | 100.0 /100 | #50 | Exceptional 3.36 |
| Nicaraguans | 100.0 /100 | #51 | Exceptional 3.36 |
| Fijians | 100.0 /100 | #52 | Exceptional 3.36 |
| Koreans | 100.0 /100 | #53 | Exceptional 3.36 |
| Immigrants | South Eastern Asia | 100.0 /100 | #54 | Exceptional 3.36 |
| Immigrants | Honduras | 100.0 /100 | #55 | Exceptional 3.36 |