Blackfeet vs Immigrants from Micronesia Single Mother Households
COMPARE
Blackfeet
Immigrants from Micronesia
Single Mother Households
Single Mother Households Comparison
Blackfeet
Immigrants from Micronesia
7.5%
SINGLE MOTHER HOUSEHOLDS
0.1/ 100
METRIC RATING
267th/ 347
METRIC RANK
6.9%
SINGLE MOTHER HOUSEHOLDS
3.6/ 100
METRIC RATING
223rd/ 347
METRIC RANK
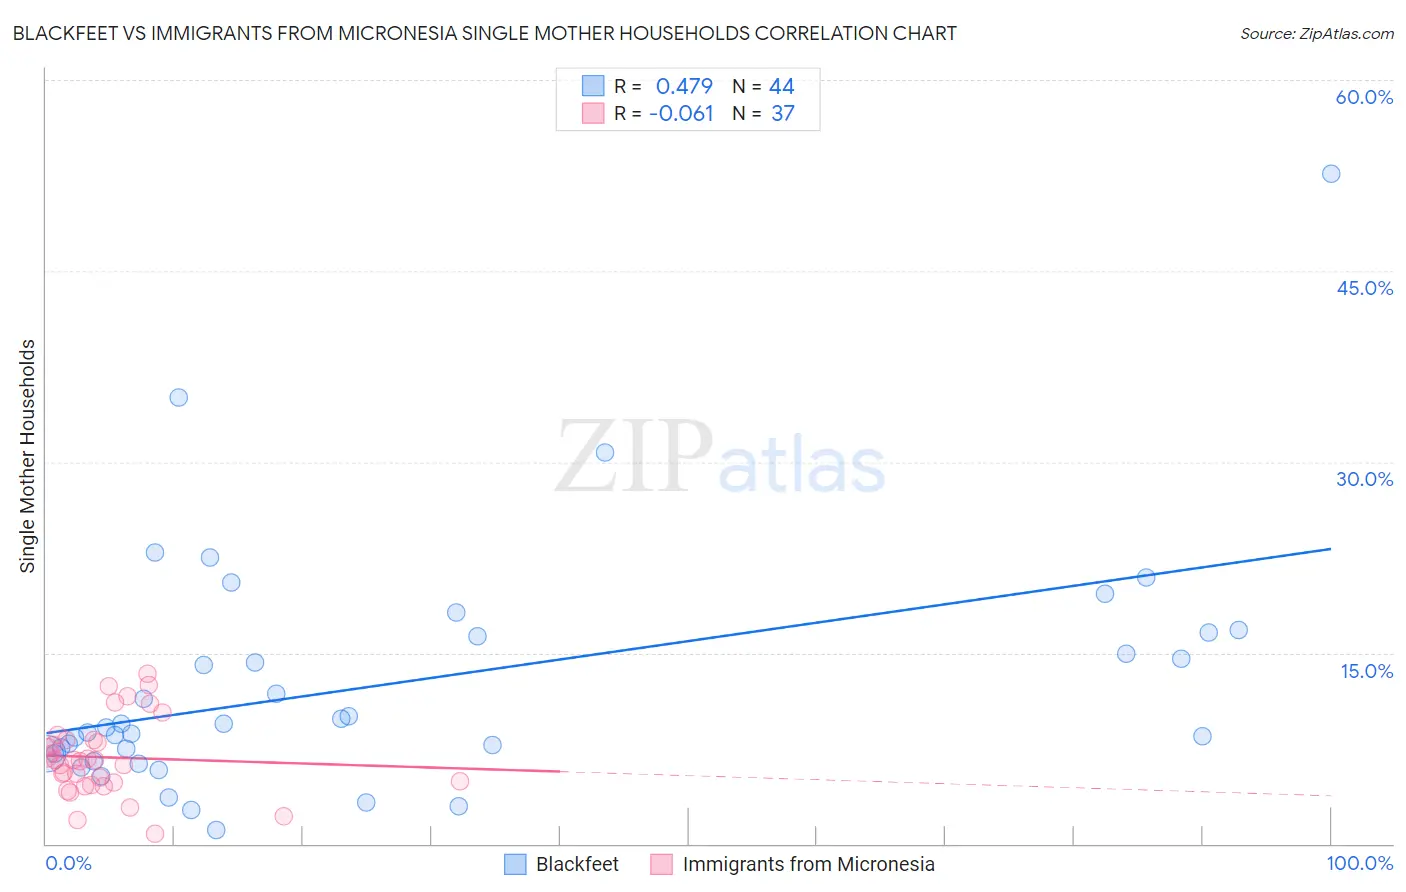
Blackfeet vs Immigrants from Micronesia Single Mother Households Correlation Chart
The statistical analysis conducted on geographies consisting of 309,066,694 people shows a moderate positive correlation between the proportion of Blackfeet and percentage of single mother households in the United States with a correlation coefficient (R) of 0.479 and weighted average of 7.5%. Similarly, the statistical analysis conducted on geographies consisting of 61,584,620 people shows a slight negative correlation between the proportion of Immigrants from Micronesia and percentage of single mother households in the United States with a correlation coefficient (R) of -0.061 and weighted average of 6.9%, a difference of 8.8%.
Single Mother Households Correlation Summary
| Measurement | Blackfeet | Immigrants from Micronesia |
| Minimum | 1.1% | 0.77% |
| Maximum | 52.6% | 13.3% |
| Range | 51.5% | 12.5% |
| Mean | 12.5% | 6.8% |
| Median | 9.2% | 6.5% |
| Interquartile 25% (IQ1) | 7.1% | 4.7% |
| Interquartile 75% (IQ3) | 16.4% | 8.1% |
| Interquartile Range (IQR) | 9.3% | 3.4% |
| Standard Deviation (Sample) | 9.5% | 3.0% |
| Standard Deviation (Population) | 9.4% | 3.0% |
Similar Demographics by Single Mother Households
Demographics Similar to Blackfeet by Single Mother Households
In terms of single mother households, the demographic groups most similar to Blackfeet are Indonesian (7.5%, a difference of 0.040%), Nepalese (7.5%, a difference of 0.34%), Crow (7.4%, a difference of 0.43%), Somali (7.5%, a difference of 0.45%), and Yaqui (7.4%, a difference of 0.61%).
| Demographics | Rating | Rank | Single Mother Households |
| Immigrants | Zaire | 0.2 /100 | #260 | Tragic 7.4% |
| Japanese | 0.2 /100 | #261 | Tragic 7.4% |
| Immigrants | Somalia | 0.2 /100 | #262 | Tragic 7.4% |
| Immigrants | Nicaragua | 0.2 /100 | #263 | Tragic 7.4% |
| Yaqui | 0.1 /100 | #264 | Tragic 7.4% |
| Crow | 0.1 /100 | #265 | Tragic 7.4% |
| Nepalese | 0.1 /100 | #266 | Tragic 7.5% |
| Blackfeet | 0.1 /100 | #267 | Tragic 7.5% |
| Indonesians | 0.1 /100 | #268 | Tragic 7.5% |
| Somalis | 0.1 /100 | #269 | Tragic 7.5% |
| Immigrants | Cuba | 0.1 /100 | #270 | Tragic 7.5% |
| Salvadorans | 0.1 /100 | #271 | Tragic 7.5% |
| Immigrants | Azores | 0.1 /100 | #272 | Tragic 7.5% |
| Belizeans | 0.1 /100 | #273 | Tragic 7.6% |
| Immigrants | Guyana | 0.1 /100 | #274 | Tragic 7.6% |
Demographics Similar to Immigrants from Micronesia by Single Mother Households
In terms of single mother households, the demographic groups most similar to Immigrants from Micronesia are Immigrants from Bangladesh (6.9%, a difference of 0.050%), French American Indian (6.9%, a difference of 0.070%), Immigrants from Sudan (6.9%, a difference of 0.12%), Immigrants from Thailand (6.9%, a difference of 0.26%), and Sudanese (6.9%, a difference of 0.39%).
| Demographics | Rating | Rank | Single Mother Households |
| Cherokee | 5.1 /100 | #216 | Tragic 6.8% |
| Aleuts | 4.8 /100 | #217 | Tragic 6.8% |
| Immigrants | Eastern Africa | 4.4 /100 | #218 | Tragic 6.8% |
| Immigrants | Immigrants | 4.3 /100 | #219 | Tragic 6.8% |
| Immigrants | Thailand | 4.0 /100 | #220 | Tragic 6.9% |
| French American Indians | 3.7 /100 | #221 | Tragic 6.9% |
| Immigrants | Bangladesh | 3.7 /100 | #222 | Tragic 6.9% |
| Immigrants | Micronesia | 3.6 /100 | #223 | Tragic 6.9% |
| Immigrants | Sudan | 3.5 /100 | #224 | Tragic 6.9% |
| Sudanese | 3.1 /100 | #225 | Tragic 6.9% |
| Paiute | 2.4 /100 | #226 | Tragic 7.0% |
| Kenyans | 2.3 /100 | #227 | Tragic 7.0% |
| Iroquois | 2.2 /100 | #228 | Tragic 7.0% |
| Immigrants | Kenya | 2.1 /100 | #229 | Tragic 7.0% |
| Creek | 1.6 /100 | #230 | Tragic 7.0% |