Salvadoran vs Immigrants from Middle Africa Median Male Earnings
COMPARE
Salvadoran
Immigrants from Middle Africa
Median Male Earnings
Median Male Earnings Comparison
Salvadorans
Immigrants from Middle Africa
$48,646
MEDIAN MALE EARNINGS
0.3/ 100
METRIC RATING
272nd/ 347
METRIC RANK
$49,201
MEDIAN MALE EARNINGS
0.6/ 100
METRIC RATING
264th/ 347
METRIC RANK
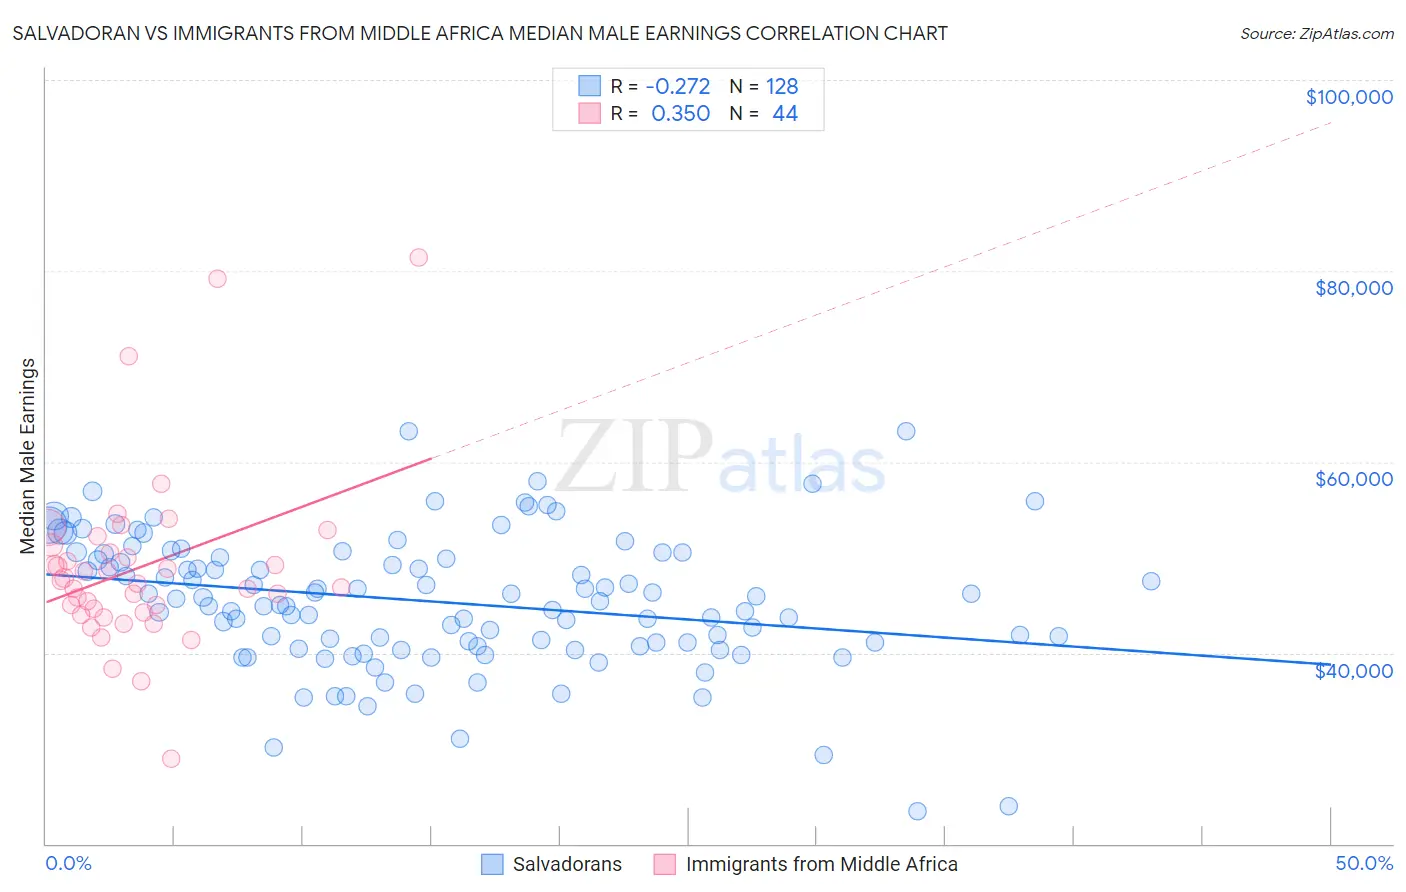
Salvadoran vs Immigrants from Middle Africa Median Male Earnings Correlation Chart
The statistical analysis conducted on geographies consisting of 398,918,079 people shows a weak negative correlation between the proportion of Salvadorans and median male earnings in the United States with a correlation coefficient (R) of -0.272 and weighted average of $48,646. Similarly, the statistical analysis conducted on geographies consisting of 202,728,043 people shows a mild positive correlation between the proportion of Immigrants from Middle Africa and median male earnings in the United States with a correlation coefficient (R) of 0.350 and weighted average of $49,201, a difference of 1.1%.
Median Male Earnings Correlation Summary
| Measurement | Salvadoran | Immigrants from Middle Africa |
| Minimum | $23,439 | $28,882 |
| Maximum | $63,214 | $81,458 |
| Range | $39,775 | $52,576 |
| Mean | $45,362 | $48,940 |
| Median | $45,515 | $47,419 |
| Interquartile 25% (IQ1) | $40,883 | $44,462 |
| Interquartile 75% (IQ3) | $50,182 | $50,890 |
| Interquartile Range (IQR) | $9,299 | $6,428 |
| Standard Deviation (Sample) | $7,004 | $9,309 |
| Standard Deviation (Population) | $6,977 | $9,202 |
Demographics Similar to Salvadorans and Immigrants from Middle Africa by Median Male Earnings
In terms of median male earnings, the demographic groups most similar to Salvadorans are Jamaican ($48,632, a difference of 0.030%), Cherokee ($48,669, a difference of 0.050%), Potawatomi ($48,768, a difference of 0.25%), Colville ($48,516, a difference of 0.27%), and Tsimshian ($48,836, a difference of 0.39%). Similarly, the demographic groups most similar to Immigrants from Middle Africa are Immigrants from Laos ($49,190, a difference of 0.020%), Nicaraguan ($49,215, a difference of 0.030%), Immigrants from West Indies ($49,271, a difference of 0.14%), Liberian ($49,318, a difference of 0.24%), and Iroquois ($49,374, a difference of 0.35%).
| Demographics | Rating | Rank | Median Male Earnings |
| Cree | 0.7 /100 | #258 | Tragic $49,497 |
| Nepalese | 0.7 /100 | #259 | Tragic $49,458 |
| Iroquois | 0.7 /100 | #260 | Tragic $49,374 |
| Liberians | 0.6 /100 | #261 | Tragic $49,318 |
| Immigrants | West Indies | 0.6 /100 | #262 | Tragic $49,271 |
| Nicaraguans | 0.6 /100 | #263 | Tragic $49,215 |
| Immigrants | Middle Africa | 0.6 /100 | #264 | Tragic $49,201 |
| Immigrants | Laos | 0.6 /100 | #265 | Tragic $49,190 |
| Somalis | 0.5 /100 | #266 | Tragic $49,025 |
| Spanish Americans | 0.5 /100 | #267 | Tragic $49,008 |
| Ute | 0.4 /100 | #268 | Tragic $48,899 |
| Tsimshian | 0.4 /100 | #269 | Tragic $48,836 |
| Potawatomi | 0.4 /100 | #270 | Tragic $48,768 |
| Cherokee | 0.3 /100 | #271 | Tragic $48,669 |
| Salvadorans | 0.3 /100 | #272 | Tragic $48,646 |
| Jamaicans | 0.3 /100 | #273 | Tragic $48,632 |
| Colville | 0.3 /100 | #274 | Tragic $48,516 |
| Immigrants | Somalia | 0.3 /100 | #275 | Tragic $48,439 |
| Blackfeet | 0.3 /100 | #276 | Tragic $48,402 |
| Belizeans | 0.2 /100 | #277 | Tragic $48,358 |
| Immigrants | Liberia | 0.2 /100 | #278 | Tragic $48,317 |