Brazilian vs Nonimmigrants Single Father Households
COMPARE
Brazilian
Nonimmigrants
Single Father Households
Single Father Households Comparison
Brazilians
Nonimmigrants
2.2%
SINGLE FATHER HOUSEHOLDS
92.8/ 100
METRIC RATING
139th/ 347
METRIC RANK
2.4%
SINGLE FATHER HOUSEHOLDS
7.6/ 100
METRIC RATING
231st/ 347
METRIC RANK
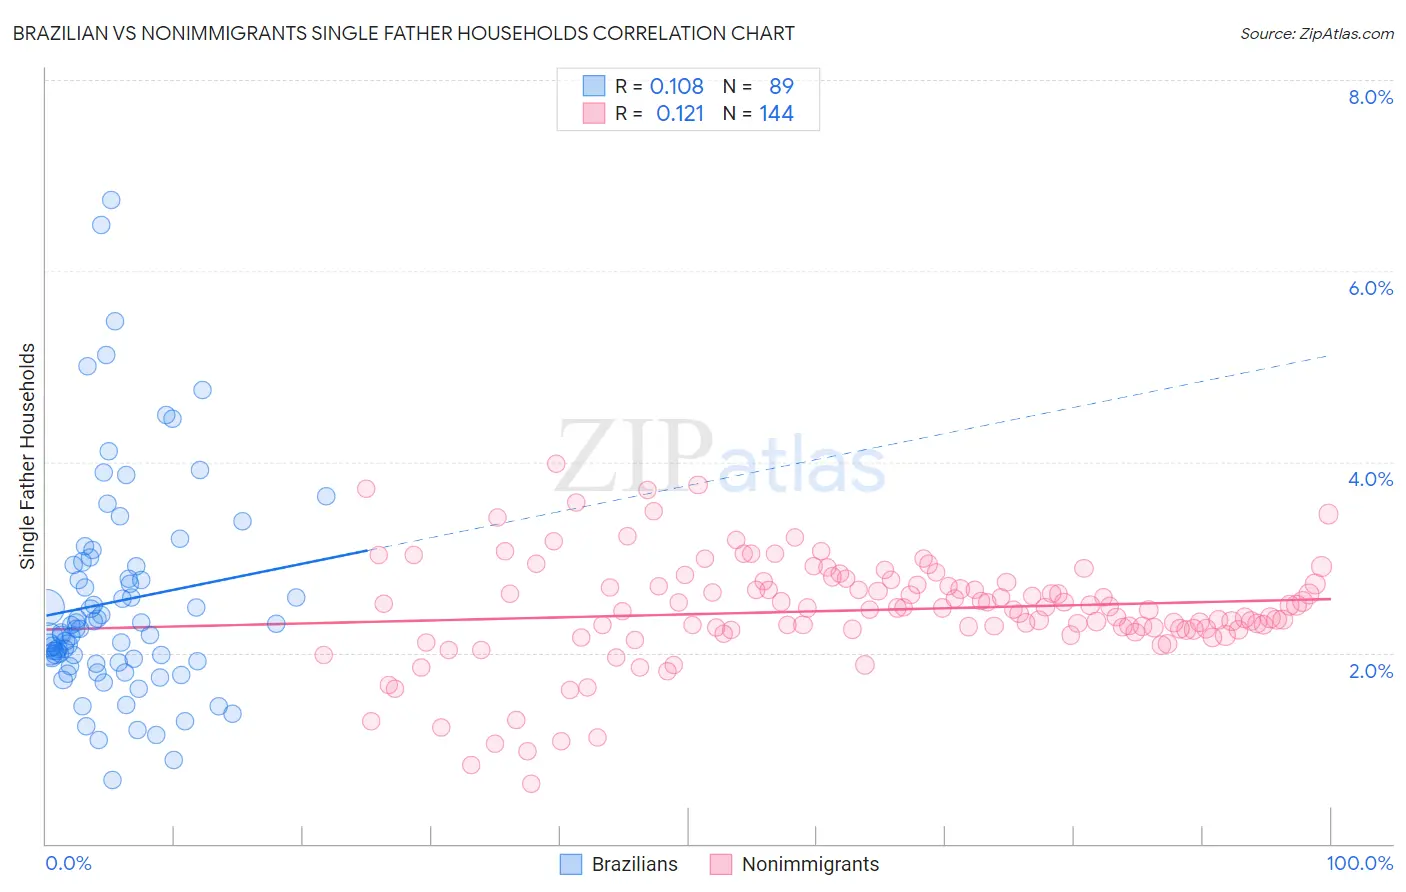
Brazilian vs Nonimmigrants Single Father Households Correlation Chart
The statistical analysis conducted on geographies consisting of 321,679,292 people shows a poor positive correlation between the proportion of Brazilians and percentage of single father households in the United States with a correlation coefficient (R) of 0.108 and weighted average of 2.2%. Similarly, the statistical analysis conducted on geographies consisting of 565,890,376 people shows a poor positive correlation between the proportion of Nonimmigrants and percentage of single father households in the United States with a correlation coefficient (R) of 0.121 and weighted average of 2.4%, a difference of 9.8%.
Single Father Households Correlation Summary
| Measurement | Brazilian | Nonimmigrants |
| Minimum | 0.67% | 0.62% |
| Maximum | 6.7% | 4.0% |
| Range | 6.1% | 3.4% |
| Mean | 2.5% | 2.4% |
| Median | 2.2% | 2.5% |
| Interquartile 25% (IQ1) | 1.9% | 2.2% |
| Interquartile 75% (IQ3) | 2.9% | 2.7% |
| Interquartile Range (IQR) | 1.0% | 0.48% |
| Standard Deviation (Sample) | 1.1% | 0.56% |
| Standard Deviation (Population) | 1.1% | 0.56% |
Similar Demographics by Single Father Households
Demographics Similar to Brazilians by Single Father Households
In terms of single father households, the demographic groups most similar to Brazilians are British (2.2%, a difference of 0.010%), Laotian (2.2%, a difference of 0.090%), Luxembourger (2.2%, a difference of 0.13%), Immigrants from Nepal (2.2%, a difference of 0.19%), and West Indian (2.2%, a difference of 0.42%).
| Demographics | Rating | Rank | Single Father Households |
| Poles | 96.5 /100 | #132 | Exceptional 2.2% |
| Taiwanese | 96.3 /100 | #133 | Exceptional 2.2% |
| Zimbabweans | 95.1 /100 | #134 | Exceptional 2.2% |
| Syrians | 94.8 /100 | #135 | Exceptional 2.2% |
| Chileans | 94.5 /100 | #136 | Exceptional 2.2% |
| Austrians | 94.2 /100 | #137 | Exceptional 2.2% |
| West Indians | 94.1 /100 | #138 | Exceptional 2.2% |
| Brazilians | 92.8 /100 | #139 | Exceptional 2.2% |
| British | 92.8 /100 | #140 | Exceptional 2.2% |
| Laotians | 92.5 /100 | #141 | Exceptional 2.2% |
| Luxembourgers | 92.3 /100 | #142 | Exceptional 2.2% |
| Immigrants | Nepal | 92.1 /100 | #143 | Exceptional 2.2% |
| Slovaks | 90.7 /100 | #144 | Exceptional 2.2% |
| Immigrants | Zimbabwe | 90.2 /100 | #145 | Exceptional 2.2% |
| Northern Europeans | 89.8 /100 | #146 | Excellent 2.2% |
Demographics Similar to Nonimmigrants by Single Father Households
In terms of single father households, the demographic groups most similar to Nonimmigrants are Pennsylvania German (2.4%, a difference of 0.080%), Immigrants from Western Africa (2.4%, a difference of 0.14%), Subsaharan African (2.4%, a difference of 0.16%), Immigrants from Zaire (2.4%, a difference of 0.25%), and African (2.5%, a difference of 0.34%).
| Demographics | Rating | Rank | Single Father Households |
| Immigrants | Bahamas | 10.6 /100 | #224 | Poor 2.4% |
| Marshallese | 9.7 /100 | #225 | Tragic 2.4% |
| Blacks/African Americans | 9.7 /100 | #226 | Tragic 2.4% |
| Americans | 9.3 /100 | #227 | Tragic 2.4% |
| Immigrants | Ghana | 9.1 /100 | #228 | Tragic 2.4% |
| Immigrants | Zaire | 8.6 /100 | #229 | Tragic 2.4% |
| Sub-Saharan Africans | 8.3 /100 | #230 | Tragic 2.4% |
| Immigrants | Nonimmigrants | 7.6 /100 | #231 | Tragic 2.4% |
| Pennsylvania Germans | 7.3 /100 | #232 | Tragic 2.4% |
| Immigrants | Western Africa | 7.0 /100 | #233 | Tragic 2.4% |
| Africans | 6.3 /100 | #234 | Tragic 2.5% |
| Immigrants | Immigrants | 6.3 /100 | #235 | Tragic 2.5% |
| Cajuns | 6.1 /100 | #236 | Tragic 2.5% |
| Sierra Leoneans | 5.9 /100 | #237 | Tragic 2.5% |
| Immigrants | Sierra Leone | 5.8 /100 | #238 | Tragic 2.5% |