Ottawa vs Alaska Native Single Mother Households
COMPARE
Ottawa
Alaska Native
Single Mother Households
Single Mother Households Comparison
Ottawa
Alaska Natives
6.5%
SINGLE MOTHER HOUSEHOLDS
23.8/ 100
METRIC RATING
188th/ 347
METRIC RANK
7.4%
SINGLE MOTHER HOUSEHOLDS
0.2/ 100
METRIC RATING
257th/ 347
METRIC RANK
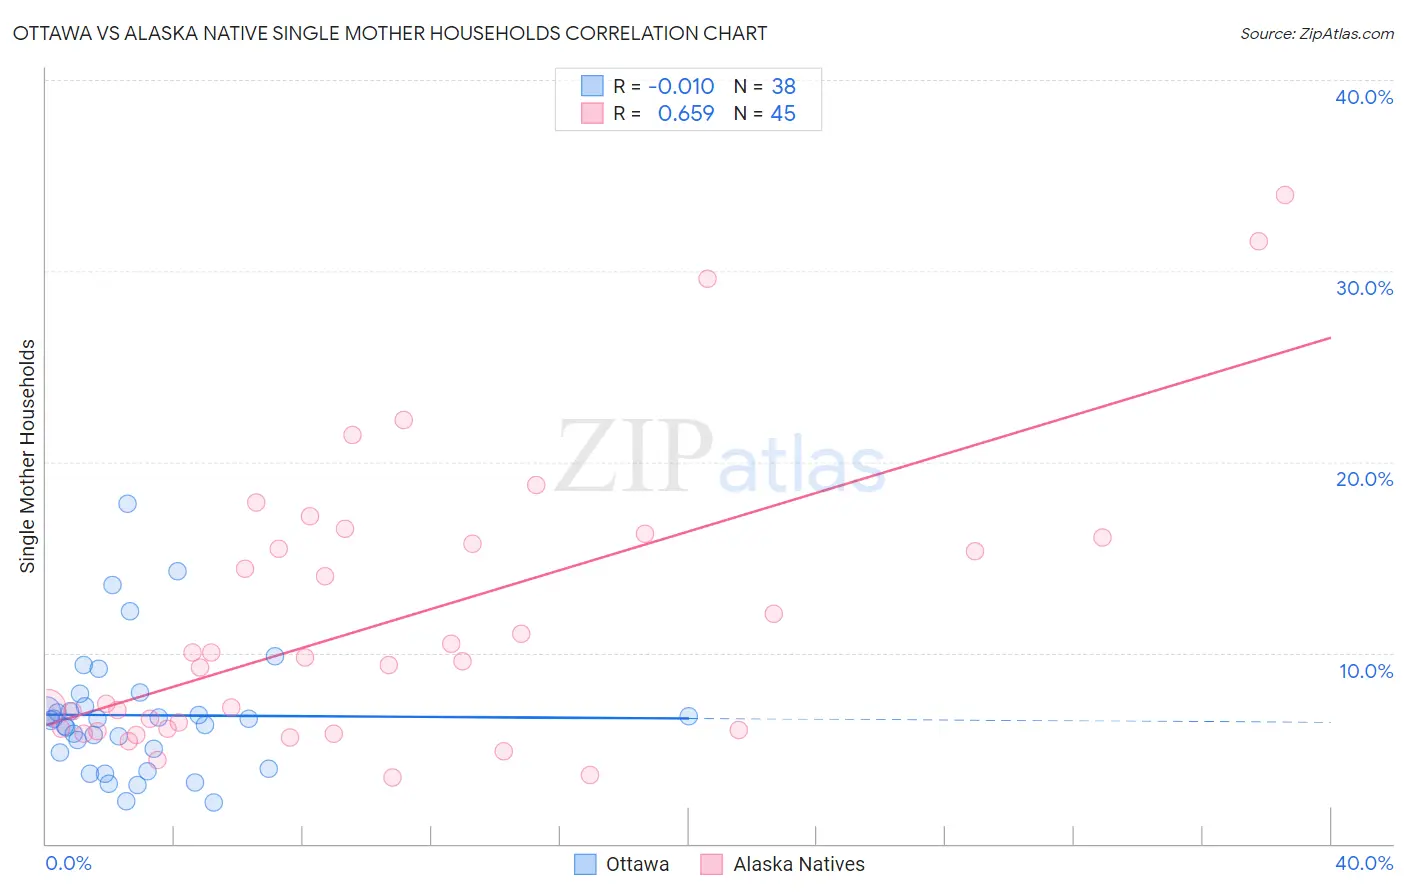
Ottawa vs Alaska Native Single Mother Households Correlation Chart
The statistical analysis conducted on geographies consisting of 49,919,182 people shows no correlation between the proportion of Ottawa and percentage of single mother households in the United States with a correlation coefficient (R) of -0.010 and weighted average of 6.5%. Similarly, the statistical analysis conducted on geographies consisting of 76,685,666 people shows a significant positive correlation between the proportion of Alaska Natives and percentage of single mother households in the United States with a correlation coefficient (R) of 0.659 and weighted average of 7.4%, a difference of 13.6%.
Single Mother Households Correlation Summary
| Measurement | Ottawa | Alaska Native |
| Minimum | 2.2% | 3.4% |
| Maximum | 17.8% | 34.0% |
| Range | 15.6% | 30.6% |
| Mean | 6.7% | 11.7% |
| Median | 6.5% | 9.6% |
| Interquartile 25% (IQ1) | 4.8% | 6.0% |
| Interquartile 75% (IQ3) | 7.2% | 15.9% |
| Interquartile Range (IQR) | 2.4% | 9.9% |
| Standard Deviation (Sample) | 3.3% | 7.4% |
| Standard Deviation (Population) | 3.3% | 7.3% |
Similar Demographics by Single Mother Households
Demographics Similar to Ottawa by Single Mother Households
In terms of single mother households, the demographic groups most similar to Ottawa are Delaware (6.5%, a difference of 0.070%), Immigrants from Afghanistan (6.5%, a difference of 0.13%), Costa Rican (6.5%, a difference of 0.14%), Ugandan (6.5%, a difference of 0.26%), and Ethiopian (6.5%, a difference of 0.32%).
| Demographics | Rating | Rank | Single Mother Households |
| Spanish | 33.4 /100 | #181 | Fair 6.4% |
| South American Indians | 33.4 /100 | #182 | Fair 6.4% |
| Spaniards | 27.8 /100 | #183 | Fair 6.5% |
| Ethiopians | 26.0 /100 | #184 | Fair 6.5% |
| Ugandans | 25.6 /100 | #185 | Fair 6.5% |
| Costa Ricans | 24.8 /100 | #186 | Fair 6.5% |
| Immigrants | Afghanistan | 24.7 /100 | #187 | Fair 6.5% |
| Ottawa | 23.8 /100 | #188 | Fair 6.5% |
| Delaware | 23.3 /100 | #189 | Fair 6.5% |
| Peruvians | 21.6 /100 | #190 | Fair 6.5% |
| Samoans | 21.2 /100 | #191 | Fair 6.5% |
| Americans | 19.0 /100 | #192 | Poor 6.6% |
| Colombians | 18.3 /100 | #193 | Poor 6.6% |
| Immigrants | Uganda | 18.3 /100 | #194 | Poor 6.6% |
| South Americans | 18.0 /100 | #195 | Poor 6.6% |
Demographics Similar to Alaska Natives by Single Mother Households
In terms of single mother households, the demographic groups most similar to Alaska Natives are Pueblo (7.4%, a difference of 0.020%), Seminole (7.4%, a difference of 0.040%), Immigrants from Yemen (7.4%, a difference of 0.040%), Immigrants from Zaire (7.4%, a difference of 0.080%), and Japanese (7.4%, a difference of 0.10%).
| Demographics | Rating | Rank | Single Mother Households |
| Immigrants | Africa | 0.4 /100 | #250 | Tragic 7.3% |
| Malaysians | 0.3 /100 | #251 | Tragic 7.3% |
| Alaskan Athabascans | 0.3 /100 | #252 | Tragic 7.3% |
| Cajuns | 0.3 /100 | #253 | Tragic 7.3% |
| Immigrants | Ecuador | 0.3 /100 | #254 | Tragic 7.3% |
| Mexican American Indians | 0.2 /100 | #255 | Tragic 7.4% |
| Seminole | 0.2 /100 | #256 | Tragic 7.4% |
| Alaska Natives | 0.2 /100 | #257 | Tragic 7.4% |
| Pueblo | 0.2 /100 | #258 | Tragic 7.4% |
| Immigrants | Yemen | 0.2 /100 | #259 | Tragic 7.4% |
| Immigrants | Zaire | 0.2 /100 | #260 | Tragic 7.4% |
| Japanese | 0.2 /100 | #261 | Tragic 7.4% |
| Immigrants | Somalia | 0.2 /100 | #262 | Tragic 7.4% |
| Immigrants | Nicaragua | 0.2 /100 | #263 | Tragic 7.4% |
| Yaqui | 0.1 /100 | #264 | Tragic 7.4% |