Russian vs Alaska Native Householder Income Under 25 years
COMPARE
Russian
Alaska Native
Householder Income Under 25 years
Householder Income Under 25 years Comparison
Russians
Alaska Natives
$54,389
HOUSEHOLDER INCOME UNDER 25 YEARS
99.5/ 100
METRIC RATING
82nd/ 347
METRIC RANK
$54,000
HOUSEHOLDER INCOME UNDER 25 YEARS
98.8/ 100
METRIC RATING
99th/ 347
METRIC RANK
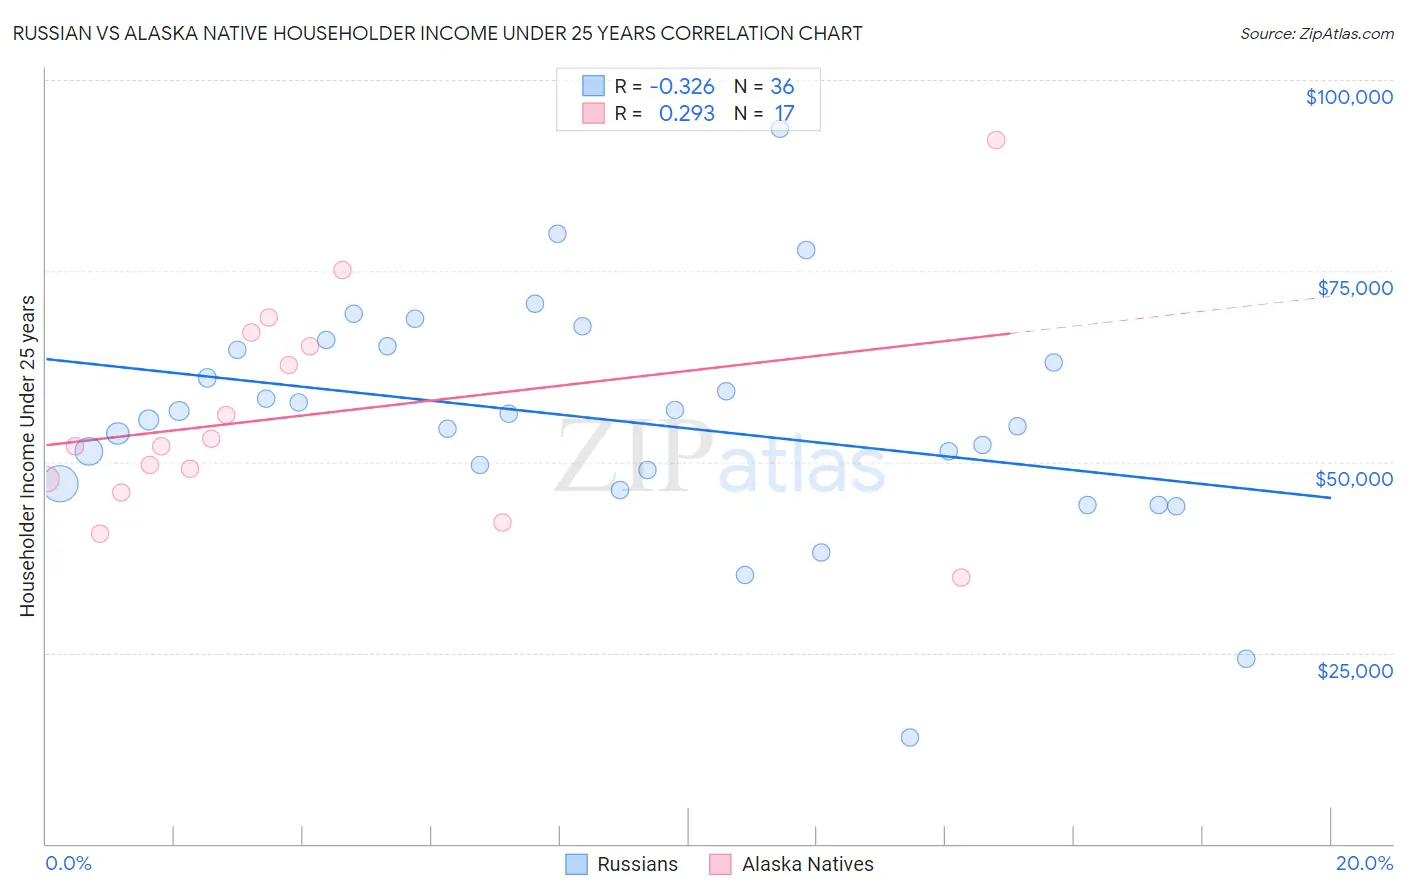
Russian vs Alaska Native Householder Income Under 25 years Correlation Chart
The statistical analysis conducted on geographies consisting of 408,933,580 people shows a mild negative correlation between the proportion of Russians and household income with householder under the age of 25 in the United States with a correlation coefficient (R) of -0.326 and weighted average of $54,389. Similarly, the statistical analysis conducted on geographies consisting of 73,501,292 people shows a weak positive correlation between the proportion of Alaska Natives and household income with householder under the age of 25 in the United States with a correlation coefficient (R) of 0.293 and weighted average of $54,000, a difference of 0.72%.
Householder Income Under 25 years Correlation Summary
| Measurement | Russian | Alaska Native |
| Minimum | $13,906 | $34,792 |
| Maximum | $93,571 | $92,109 |
| Range | $79,665 | $57,317 |
| Mean | $55,615 | $56,134 |
| Median | $55,875 | $52,108 |
| Interquartile 25% (IQ1) | $48,025 | $46,888 |
| Interquartile 75% (IQ3) | $64,893 | $66,052 |
| Interquartile Range (IQR) | $16,868 | $19,164 |
| Standard Deviation (Sample) | $14,911 | $14,277 |
| Standard Deviation (Population) | $14,703 | $13,850 |
Demographics Similar to Russians and Alaska Natives by Householder Income Under 25 years
In terms of householder income under 25 years, the demographic groups most similar to Russians are Laotian ($54,369, a difference of 0.040%), Bulgarian ($54,352, a difference of 0.070%), Immigrants from Czechoslovakia ($54,352, a difference of 0.070%), Portuguese ($54,436, a difference of 0.090%), and Immigrants from Croatia ($54,343, a difference of 0.090%). Similarly, the demographic groups most similar to Alaska Natives are Immigrants from Kazakhstan ($53,990, a difference of 0.020%), Eastern European ($54,066, a difference of 0.12%), Immigrants from Portugal ($54,105, a difference of 0.19%), Argentinean ($54,154, a difference of 0.29%), and Immigrants from Malaysia ($54,179, a difference of 0.33%).
| Demographics | Rating | Rank | Householder Income Under 25 years |
| Egyptians | 99.6 /100 | #80 | Exceptional $54,444 |
| Portuguese | 99.6 /100 | #81 | Exceptional $54,436 |
| Russians | 99.5 /100 | #82 | Exceptional $54,389 |
| Laotians | 99.5 /100 | #83 | Exceptional $54,369 |
| Bulgarians | 99.5 /100 | #84 | Exceptional $54,352 |
| Immigrants | Czechoslovakia | 99.5 /100 | #85 | Exceptional $54,352 |
| Immigrants | Croatia | 99.5 /100 | #86 | Exceptional $54,343 |
| Brazilians | 99.5 /100 | #87 | Exceptional $54,335 |
| Yakama | 99.5 /100 | #88 | Exceptional $54,321 |
| Immigrants | South America | 99.4 /100 | #89 | Exceptional $54,268 |
| Turks | 99.4 /100 | #90 | Exceptional $54,266 |
| Immigrants | Egypt | 99.3 /100 | #91 | Exceptional $54,239 |
| Immigrants | St. Vincent and the Grenadines | 99.3 /100 | #92 | Exceptional $54,230 |
| Immigrants | Argentina | 99.3 /100 | #93 | Exceptional $54,209 |
| Immigrants | Sierra Leone | 99.3 /100 | #94 | Exceptional $54,190 |
| Immigrants | Malaysia | 99.2 /100 | #95 | Exceptional $54,179 |
| Argentineans | 99.2 /100 | #96 | Exceptional $54,154 |
| Immigrants | Portugal | 99.1 /100 | #97 | Exceptional $54,105 |
| Eastern Europeans | 99.0 /100 | #98 | Exceptional $54,066 |
| Alaska Natives | 98.8 /100 | #99 | Exceptional $54,000 |
| Immigrants | Kazakhstan | 98.8 /100 | #100 | Exceptional $53,990 |