Puget Sound Salish vs Immigrants from Albania Single Mother Households
COMPARE
Puget Sound Salish
Immigrants from Albania
Single Mother Households
Single Mother Households Comparison
Puget Sound Salish
Immigrants from Albania
6.3%
SINGLE MOTHER HOUSEHOLDS
58.1/ 100
METRIC RATING
169th/ 347
METRIC RANK
6.1%
SINGLE MOTHER HOUSEHOLDS
81.5/ 100
METRIC RATING
149th/ 347
METRIC RANK
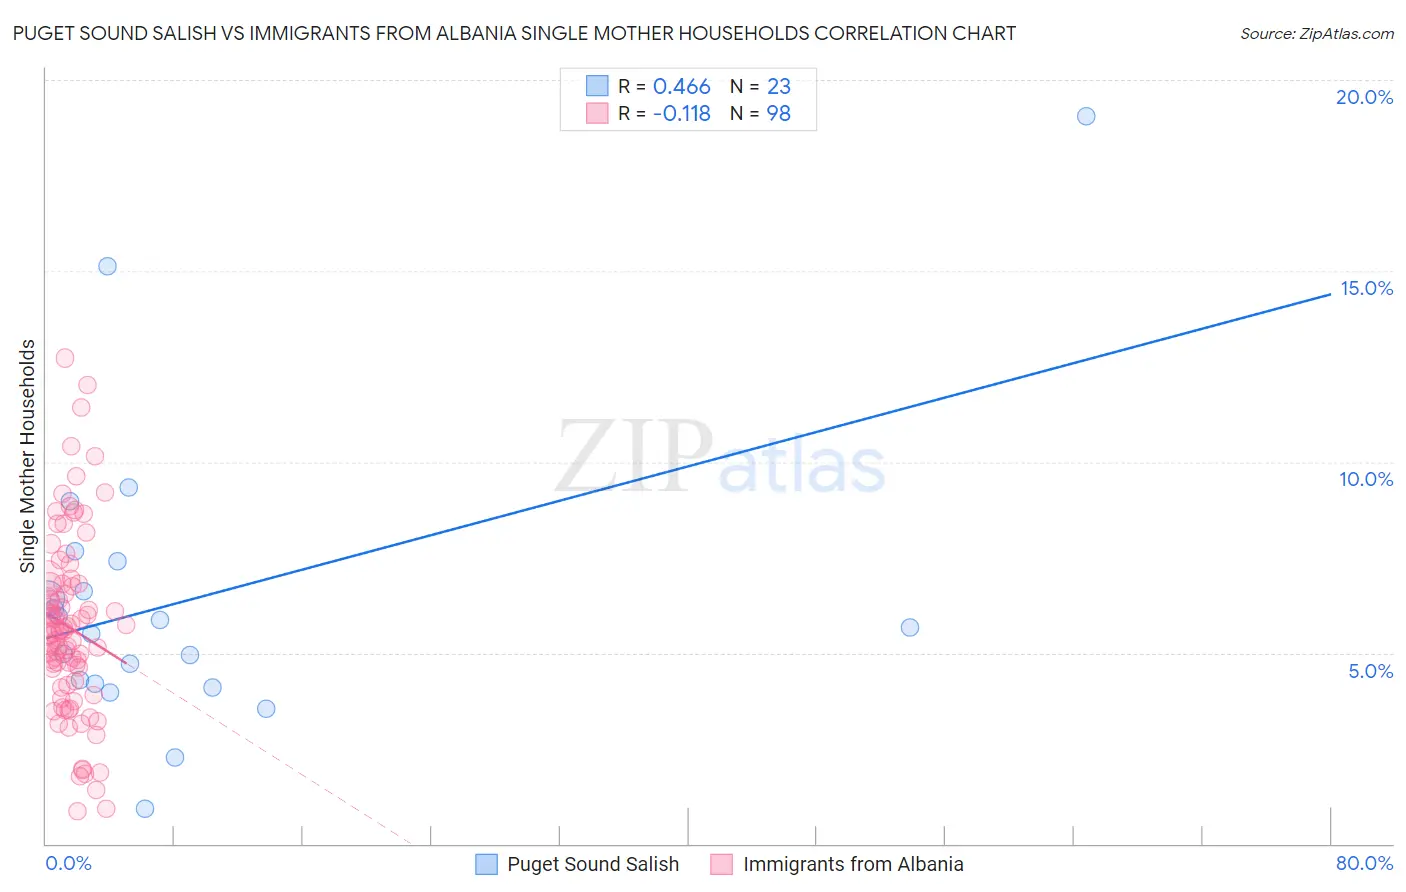
Puget Sound Salish vs Immigrants from Albania Single Mother Households Correlation Chart
The statistical analysis conducted on geographies consisting of 46,127,727 people shows a moderate positive correlation between the proportion of Puget Sound Salish and percentage of single mother households in the United States with a correlation coefficient (R) of 0.466 and weighted average of 6.3%. Similarly, the statistical analysis conducted on geographies consisting of 119,328,901 people shows a poor negative correlation between the proportion of Immigrants from Albania and percentage of single mother households in the United States with a correlation coefficient (R) of -0.118 and weighted average of 6.1%, a difference of 3.3%.
Single Mother Households Correlation Summary
| Measurement | Puget Sound Salish | Immigrants from Albania |
| Minimum | 0.93% | 0.85% |
| Maximum | 19.0% | 12.7% |
| Range | 18.1% | 11.9% |
| Mean | 6.4% | 5.7% |
| Median | 5.7% | 5.5% |
| Interquartile 25% (IQ1) | 4.2% | 4.2% |
| Interquartile 75% (IQ3) | 7.4% | 6.8% |
| Interquartile Range (IQR) | 3.2% | 2.6% |
| Standard Deviation (Sample) | 3.9% | 2.3% |
| Standard Deviation (Population) | 3.8% | 2.3% |
Demographics Similar to Puget Sound Salish and Immigrants from Albania by Single Mother Households
In terms of single mother households, the demographic groups most similar to Puget Sound Salish are Immigrants from Chile (6.3%, a difference of 0.020%), Brazilian (6.2%, a difference of 0.11%), Sri Lankan (6.2%, a difference of 0.68%), Immigrants from Syria (6.2%, a difference of 1.1%), and Immigrants from Northern Africa (6.2%, a difference of 1.2%). Similarly, the demographic groups most similar to Immigrants from Albania are Zimbabwean (6.1%, a difference of 0.14%), Immigrants from Southern Europe (6.1%, a difference of 0.19%), Pakistani (6.1%, a difference of 0.42%), Immigrants from Brazil (6.1%, a difference of 0.46%), and Immigrants from Philippines (6.1%, a difference of 0.53%).
| Demographics | Rating | Rank | Single Mother Households |
| Immigrants | Albania | 81.5 /100 | #149 | Excellent 6.1% |
| Zimbabweans | 80.7 /100 | #150 | Excellent 6.1% |
| Immigrants | Southern Europe | 80.5 /100 | #151 | Excellent 6.1% |
| Pakistanis | 79.2 /100 | #152 | Good 6.1% |
| Immigrants | Brazil | 78.9 /100 | #153 | Good 6.1% |
| Immigrants | Philippines | 78.5 /100 | #154 | Good 6.1% |
| Whites/Caucasians | 76.5 /100 | #155 | Good 6.1% |
| Native Hawaiians | 75.0 /100 | #156 | Good 6.1% |
| Chileans | 74.2 /100 | #157 | Good 6.1% |
| Celtics | 73.3 /100 | #158 | Good 6.1% |
| Yugoslavians | 73.1 /100 | #159 | Good 6.1% |
| Iraqis | 73.0 /100 | #160 | Good 6.1% |
| Immigrants | Germany | 72.4 /100 | #161 | Good 6.1% |
| Immigrants | Zimbabwe | 69.9 /100 | #162 | Good 6.2% |
| Alsatians | 68.7 /100 | #163 | Good 6.2% |
| Immigrants | Northern Africa | 68.0 /100 | #164 | Good 6.2% |
| Immigrants | Syria | 67.4 /100 | #165 | Good 6.2% |
| Sri Lankans | 63.9 /100 | #166 | Good 6.2% |
| Brazilians | 59.1 /100 | #167 | Average 6.2% |
| Immigrants | Chile | 58.3 /100 | #168 | Average 6.3% |
| Puget Sound Salish | 58.1 /100 | #169 | Average 6.3% |