Immigrants from Canada vs Immigrants from Northern Europe Single Mother Households
COMPARE
Immigrants from Canada
Immigrants from Northern Europe
Single Mother Households
Single Mother Households Comparison
Immigrants from Canada
Immigrants from Northern Europe
5.6%
SINGLE MOTHER HOUSEHOLDS
98.5/ 100
METRIC RATING
66th/ 347
METRIC RANK
5.3%
SINGLE MOTHER HOUSEHOLDS
99.7/ 100
METRIC RATING
35th/ 347
METRIC RANK
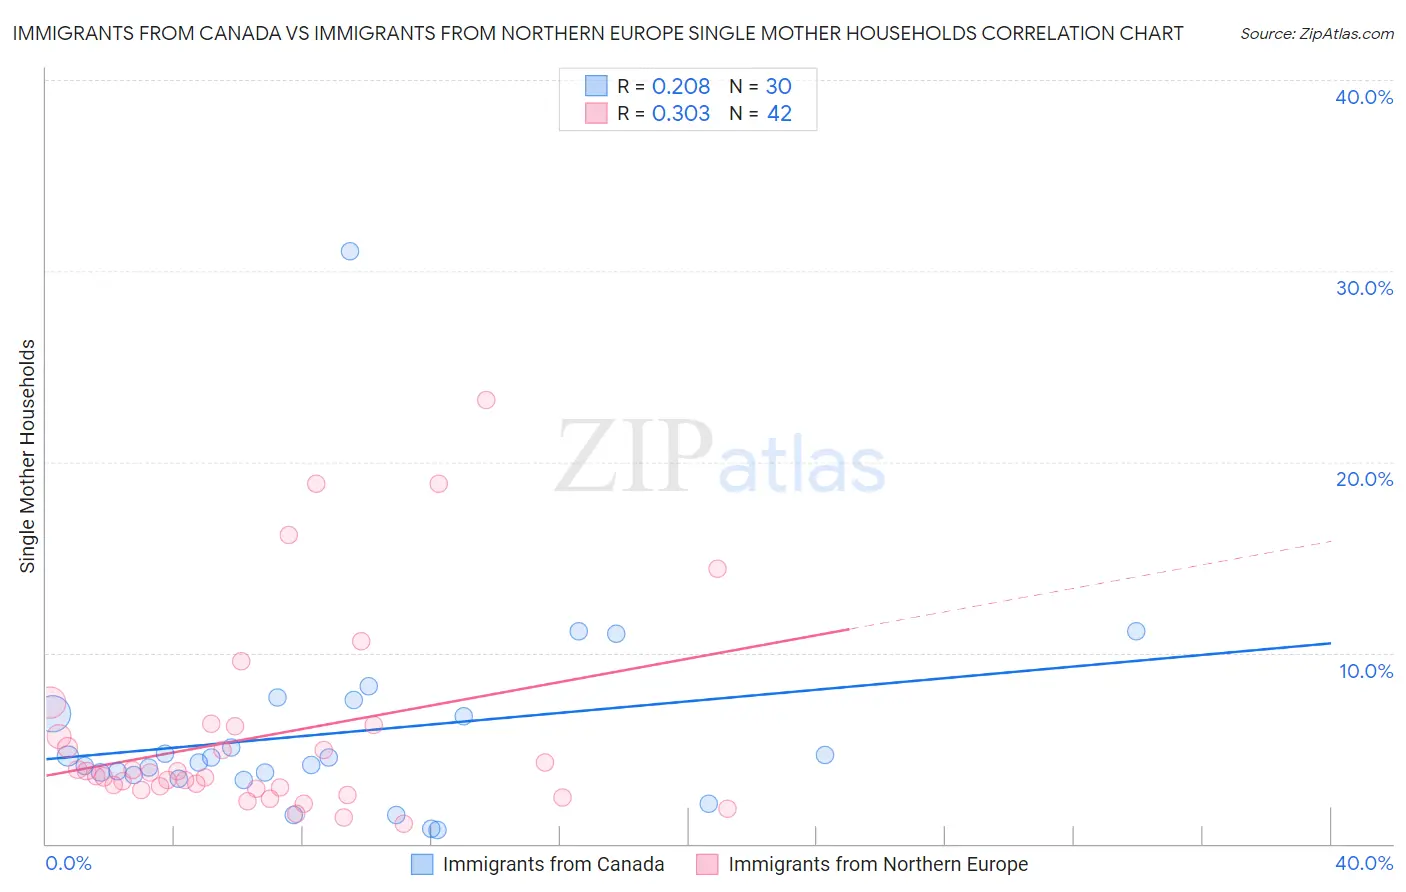
Immigrants from Canada vs Immigrants from Northern Europe Single Mother Households Correlation Chart
The statistical analysis conducted on geographies consisting of 457,332,787 people shows a weak positive correlation between the proportion of Immigrants from Canada and percentage of single mother households in the United States with a correlation coefficient (R) of 0.208 and weighted average of 5.6%. Similarly, the statistical analysis conducted on geographies consisting of 474,819,920 people shows a mild positive correlation between the proportion of Immigrants from Northern Europe and percentage of single mother households in the United States with a correlation coefficient (R) of 0.303 and weighted average of 5.3%, a difference of 5.1%.
Single Mother Households Correlation Summary
| Measurement | Immigrants from Canada | Immigrants from Northern Europe |
| Minimum | 0.70% | 1.0% |
| Maximum | 31.0% | 23.2% |
| Range | 30.3% | 22.2% |
| Mean | 5.8% | 5.6% |
| Median | 4.4% | 3.6% |
| Interquartile 25% (IQ1) | 3.6% | 2.9% |
| Interquartile 75% (IQ3) | 6.8% | 6.2% |
| Interquartile Range (IQR) | 3.2% | 3.3% |
| Standard Deviation (Sample) | 5.5% | 5.2% |
| Standard Deviation (Population) | 5.4% | 5.1% |
Similar Demographics by Single Mother Households
Demographics Similar to Immigrants from Canada by Single Mother Households
In terms of single mother households, the demographic groups most similar to Immigrants from Canada are Italian (5.6%, a difference of 0.020%), Immigrants from Bulgaria (5.6%, a difference of 0.080%), Greek (5.6%, a difference of 0.10%), Asian (5.6%, a difference of 0.11%), and Immigrants from France (5.6%, a difference of 0.15%).
| Demographics | Rating | Rank | Single Mother Households |
| Luxembourgers | 98.7 /100 | #59 | Exceptional 5.6% |
| Immigrants | Norway | 98.7 /100 | #60 | Exceptional 5.6% |
| Australians | 98.7 /100 | #61 | Exceptional 5.6% |
| Poles | 98.6 /100 | #62 | Exceptional 5.6% |
| Immigrants | North Macedonia | 98.6 /100 | #63 | Exceptional 5.6% |
| Immigrants | France | 98.6 /100 | #64 | Exceptional 5.6% |
| Greeks | 98.6 /100 | #65 | Exceptional 5.6% |
| Immigrants | Canada | 98.5 /100 | #66 | Exceptional 5.6% |
| Italians | 98.5 /100 | #67 | Exceptional 5.6% |
| Immigrants | Bulgaria | 98.5 /100 | #68 | Exceptional 5.6% |
| Asians | 98.5 /100 | #69 | Exceptional 5.6% |
| Immigrants | Eastern Europe | 98.4 /100 | #70 | Exceptional 5.6% |
| Immigrants | Kazakhstan | 98.4 /100 | #71 | Exceptional 5.6% |
| Immigrants | Netherlands | 98.4 /100 | #72 | Exceptional 5.6% |
| Immigrants | Asia | 98.4 /100 | #73 | Exceptional 5.6% |
Demographics Similar to Immigrants from Northern Europe by Single Mother Households
In terms of single mother households, the demographic groups most similar to Immigrants from Northern Europe are Bulgarian (5.3%, a difference of 0.040%), Immigrants from Switzerland (5.3%, a difference of 0.060%), Immigrants from Czechoslovakia (5.3%, a difference of 0.20%), Immigrants from Belgium (5.3%, a difference of 0.35%), and Cambodian (5.3%, a difference of 0.44%).
| Demographics | Rating | Rank | Single Mother Households |
| Russians | 99.7 /100 | #28 | Exceptional 5.3% |
| Latvians | 99.7 /100 | #29 | Exceptional 5.3% |
| Burmese | 99.7 /100 | #30 | Exceptional 5.3% |
| Immigrants | Korea | 99.7 /100 | #31 | Exceptional 5.3% |
| Cambodians | 99.7 /100 | #32 | Exceptional 5.3% |
| Immigrants | Switzerland | 99.7 /100 | #33 | Exceptional 5.3% |
| Bulgarians | 99.7 /100 | #34 | Exceptional 5.3% |
| Immigrants | Northern Europe | 99.7 /100 | #35 | Exceptional 5.3% |
| Immigrants | Czechoslovakia | 99.7 /100 | #36 | Exceptional 5.3% |
| Immigrants | Belgium | 99.7 /100 | #37 | Exceptional 5.3% |
| Immigrants | Serbia | 99.6 /100 | #38 | Exceptional 5.4% |
| Immigrants | Sweden | 99.6 /100 | #39 | Exceptional 5.4% |
| Estonians | 99.6 /100 | #40 | Exceptional 5.4% |
| Immigrants | Greece | 99.5 /100 | #41 | Exceptional 5.4% |
| Macedonians | 99.5 /100 | #42 | Exceptional 5.4% |