Tohono O'odham vs Immigrants from Northern Europe Single Mother Households
COMPARE
Tohono O'odham
Immigrants from Northern Europe
Single Mother Households
Single Mother Households Comparison
Tohono O'odham
Immigrants from Northern Europe
9.1%
SINGLE MOTHER HOUSEHOLDS
0.0/ 100
METRIC RATING
341st/ 347
METRIC RANK
5.3%
SINGLE MOTHER HOUSEHOLDS
99.7/ 100
METRIC RATING
35th/ 347
METRIC RANK
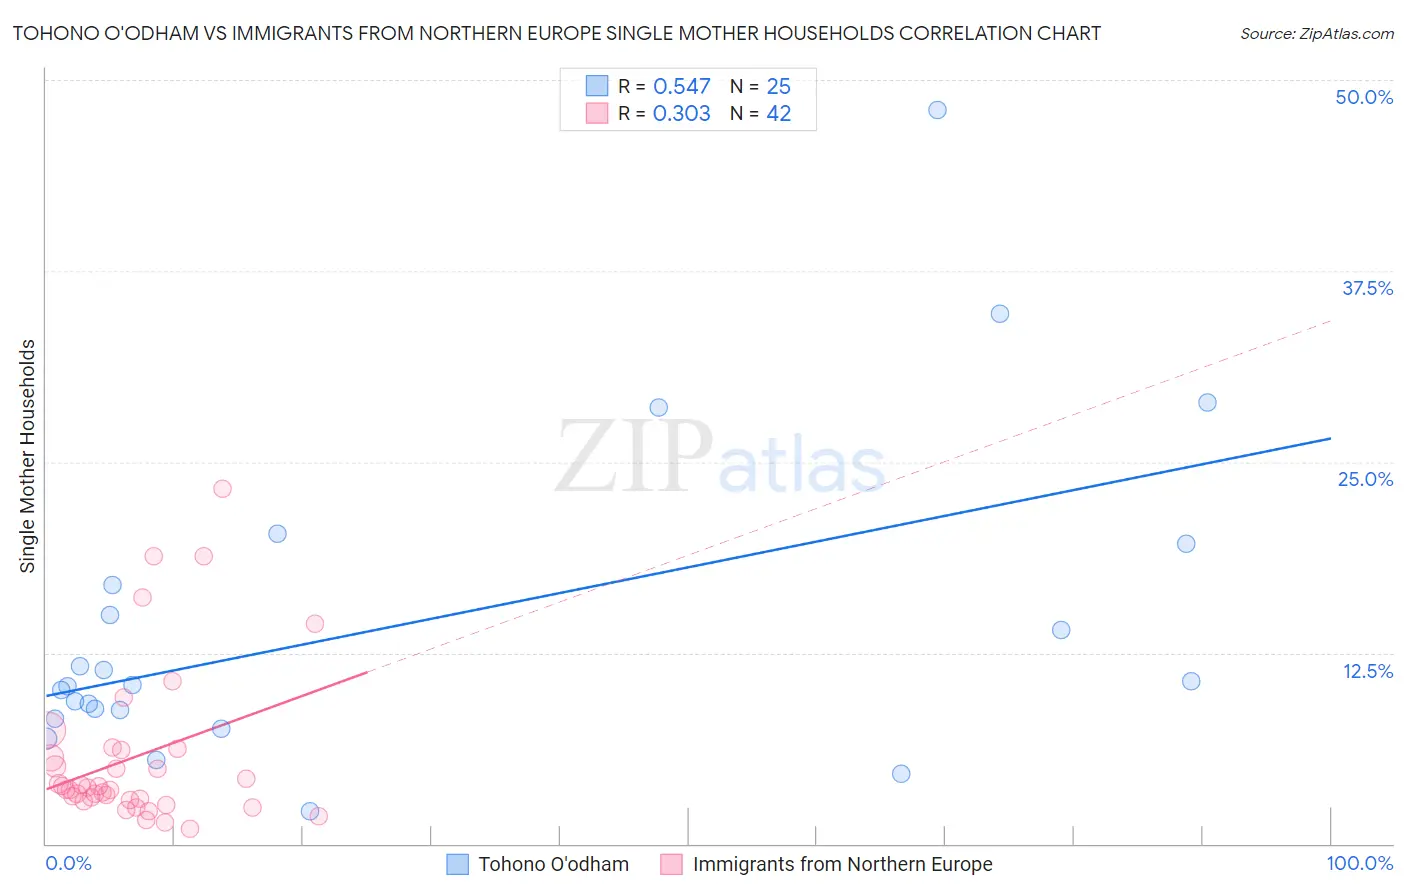
Tohono O'odham vs Immigrants from Northern Europe Single Mother Households Correlation Chart
The statistical analysis conducted on geographies consisting of 58,690,271 people shows a substantial positive correlation between the proportion of Tohono O'odham and percentage of single mother households in the United States with a correlation coefficient (R) of 0.547 and weighted average of 9.1%. Similarly, the statistical analysis conducted on geographies consisting of 474,819,920 people shows a mild positive correlation between the proportion of Immigrants from Northern Europe and percentage of single mother households in the United States with a correlation coefficient (R) of 0.303 and weighted average of 5.3%, a difference of 71.9%.
Single Mother Households Correlation Summary
| Measurement | Tohono O'odham | Immigrants from Northern Europe |
| Minimum | 2.1% | 1.0% |
| Maximum | 48.0% | 23.2% |
| Range | 45.9% | 22.2% |
| Mean | 14.4% | 5.6% |
| Median | 10.4% | 3.6% |
| Interquartile 25% (IQ1) | 8.5% | 2.9% |
| Interquartile 75% (IQ3) | 18.3% | 6.2% |
| Interquartile Range (IQR) | 9.8% | 3.3% |
| Standard Deviation (Sample) | 10.6% | 5.2% |
| Standard Deviation (Population) | 10.4% | 5.1% |
Similar Demographics by Single Mother Households
Demographics Similar to Tohono O'odham by Single Mother Households
In terms of single mother households, the demographic groups most similar to Tohono O'odham are Menominee (9.2%, a difference of 0.32%), Lumbee (9.1%, a difference of 0.36%), Dominican (9.2%, a difference of 0.53%), Black/African American (9.0%, a difference of 1.6%), and Cape Verdean (8.9%, a difference of 3.2%).
| Demographics | Rating | Rank | Single Mother Households |
| Liberians | 0.0 /100 | #333 | Tragic 8.6% |
| Immigrants | Liberia | 0.0 /100 | #334 | Tragic 8.7% |
| Immigrants | Dominica | 0.0 /100 | #335 | Tragic 8.7% |
| Puerto Ricans | 0.0 /100 | #336 | Tragic 8.7% |
| Navajo | 0.0 /100 | #337 | Tragic 8.8% |
| Cape Verdeans | 0.0 /100 | #338 | Tragic 8.9% |
| Blacks/African Americans | 0.0 /100 | #339 | Tragic 9.0% |
| Lumbee | 0.0 /100 | #340 | Tragic 9.1% |
| Tohono O'odham | 0.0 /100 | #341 | Tragic 9.1% |
| Menominee | 0.0 /100 | #342 | Tragic 9.2% |
| Dominicans | 0.0 /100 | #343 | Tragic 9.2% |
| Immigrants | Dominican Republic | 0.0 /100 | #344 | Tragic 9.5% |
| Immigrants | Cabo Verde | 0.0 /100 | #345 | Tragic 9.6% |
| Yuman | 0.0 /100 | #346 | Tragic 9.6% |
| Yup'ik | 0.0 /100 | #347 | Tragic 10.0% |
Demographics Similar to Immigrants from Northern Europe by Single Mother Households
In terms of single mother households, the demographic groups most similar to Immigrants from Northern Europe are Bulgarian (5.3%, a difference of 0.040%), Immigrants from Switzerland (5.3%, a difference of 0.060%), Immigrants from Czechoslovakia (5.3%, a difference of 0.20%), Immigrants from Belgium (5.3%, a difference of 0.35%), and Cambodian (5.3%, a difference of 0.44%).
| Demographics | Rating | Rank | Single Mother Households |
| Russians | 99.7 /100 | #28 | Exceptional 5.3% |
| Latvians | 99.7 /100 | #29 | Exceptional 5.3% |
| Burmese | 99.7 /100 | #30 | Exceptional 5.3% |
| Immigrants | Korea | 99.7 /100 | #31 | Exceptional 5.3% |
| Cambodians | 99.7 /100 | #32 | Exceptional 5.3% |
| Immigrants | Switzerland | 99.7 /100 | #33 | Exceptional 5.3% |
| Bulgarians | 99.7 /100 | #34 | Exceptional 5.3% |
| Immigrants | Northern Europe | 99.7 /100 | #35 | Exceptional 5.3% |
| Immigrants | Czechoslovakia | 99.7 /100 | #36 | Exceptional 5.3% |
| Immigrants | Belgium | 99.7 /100 | #37 | Exceptional 5.3% |
| Immigrants | Serbia | 99.6 /100 | #38 | Exceptional 5.4% |
| Immigrants | Sweden | 99.6 /100 | #39 | Exceptional 5.4% |
| Estonians | 99.6 /100 | #40 | Exceptional 5.4% |
| Immigrants | Greece | 99.5 /100 | #41 | Exceptional 5.4% |
| Macedonians | 99.5 /100 | #42 | Exceptional 5.4% |