Puerto Rican vs Slovene Family Households with Children
COMPARE
Puerto Rican
Slovene
Family Households with Children
Family Households with Children Comparison
Puerto Ricans
Slovenes
25.6%
FAMILY HOUSEHOLDS WITH CHILDREN
0.0/ 100
METRIC RATING
337th/ 347
METRIC RANK
25.8%
FAMILY HOUSEHOLDS WITH CHILDREN
0.0/ 100
METRIC RATING
331st/ 347
METRIC RANK
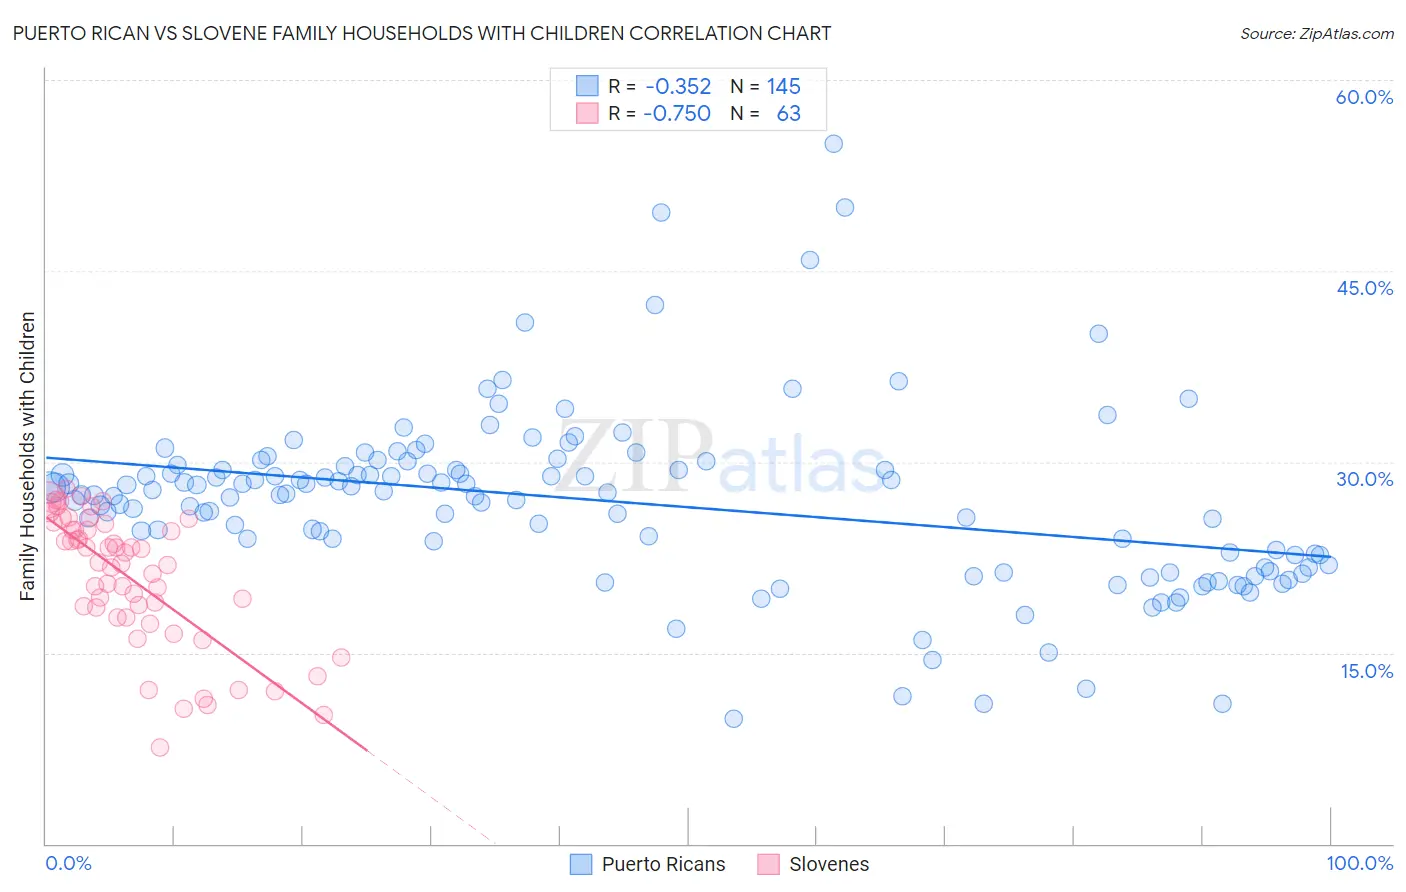
Puerto Rican vs Slovene Family Households with Children Correlation Chart
The statistical analysis conducted on geographies consisting of 527,477,936 people shows a mild negative correlation between the proportion of Puerto Ricans and percentage of family households with children in the United States with a correlation coefficient (R) of -0.352 and weighted average of 25.6%. Similarly, the statistical analysis conducted on geographies consisting of 261,178,360 people shows a strong negative correlation between the proportion of Slovenes and percentage of family households with children in the United States with a correlation coefficient (R) of -0.750 and weighted average of 25.8%, a difference of 0.95%.
Family Households with Children Correlation Summary
| Measurement | Puerto Rican | Slovene |
| Minimum | 9.8% | 7.6% |
| Maximum | 54.9% | 27.9% |
| Range | 45.1% | 20.3% |
| Mean | 26.9% | 20.9% |
| Median | 27.4% | 22.1% |
| Interquartile 25% (IQ1) | 22.3% | 17.8% |
| Interquartile 75% (IQ3) | 29.5% | 25.2% |
| Interquartile Range (IQR) | 7.3% | 7.4% |
| Standard Deviation (Sample) | 6.9% | 5.2% |
| Standard Deviation (Population) | 6.9% | 5.1% |
Demographics Similar to Puerto Ricans and Slovenes by Family Households with Children
In terms of family households with children, the demographic groups most similar to Puerto Ricans are Arapaho (25.6%, a difference of 0.030%), Immigrants from St. Vincent and the Grenadines (25.6%, a difference of 0.040%), Immigrants from Armenia (25.6%, a difference of 0.080%), Immigrants from West Indies (25.7%, a difference of 0.39%), and Immigrants from Serbia (25.5%, a difference of 0.46%). Similarly, the demographic groups most similar to Slovenes are Immigrants from Latvia (25.9%, a difference of 0.13%), Immigrants from Austria (25.8%, a difference of 0.23%), Cypriot (25.9%, a difference of 0.31%), Immigrants from Switzerland (25.7%, a difference of 0.31%), and Immigrants from Albania (25.9%, a difference of 0.44%).
| Demographics | Rating | Rank | Family Households with Children |
| Chinese | 0.0 /100 | #324 | Tragic 26.0% |
| Barbadians | 0.0 /100 | #325 | Tragic 26.0% |
| Immigrants | Ireland | 0.0 /100 | #326 | Tragic 26.0% |
| Immigrants | Barbados | 0.0 /100 | #327 | Tragic 26.0% |
| Immigrants | Albania | 0.0 /100 | #328 | Tragic 25.9% |
| Cypriots | 0.0 /100 | #329 | Tragic 25.9% |
| Immigrants | Latvia | 0.0 /100 | #330 | Tragic 25.9% |
| Slovenes | 0.0 /100 | #331 | Tragic 25.8% |
| Immigrants | Austria | 0.0 /100 | #332 | Tragic 25.8% |
| Immigrants | Switzerland | 0.0 /100 | #333 | Tragic 25.7% |
| Slovaks | 0.0 /100 | #334 | Tragic 25.7% |
| Immigrants | Croatia | 0.0 /100 | #335 | Tragic 25.7% |
| Immigrants | West Indies | 0.0 /100 | #336 | Tragic 25.7% |
| Puerto Ricans | 0.0 /100 | #337 | Tragic 25.6% |
| Arapaho | 0.0 /100 | #338 | Tragic 25.6% |
| Immigrants | St. Vincent and the Grenadines | 0.0 /100 | #339 | Tragic 25.6% |
| Immigrants | Armenia | 0.0 /100 | #340 | Tragic 25.6% |
| Immigrants | Serbia | 0.0 /100 | #341 | Tragic 25.5% |
| Alsatians | 0.0 /100 | #342 | Tragic 25.3% |
| Hopi | 0.0 /100 | #343 | Tragic 25.2% |
| Pueblo | 0.0 /100 | #344 | Tragic 25.2% |