Brazilian vs Carpatho Rusyn Family Households
COMPARE
Brazilian
Carpatho Rusyn
Family Households
Family Households Comparison
Brazilians
Carpatho Rusyns
63.9%
FAMILY HOUSEHOLDS
12.4/ 100
METRIC RATING
205th/ 347
METRIC RANK
61.1%
FAMILY HOUSEHOLDS
0.0/ 100
METRIC RATING
335th/ 347
METRIC RANK
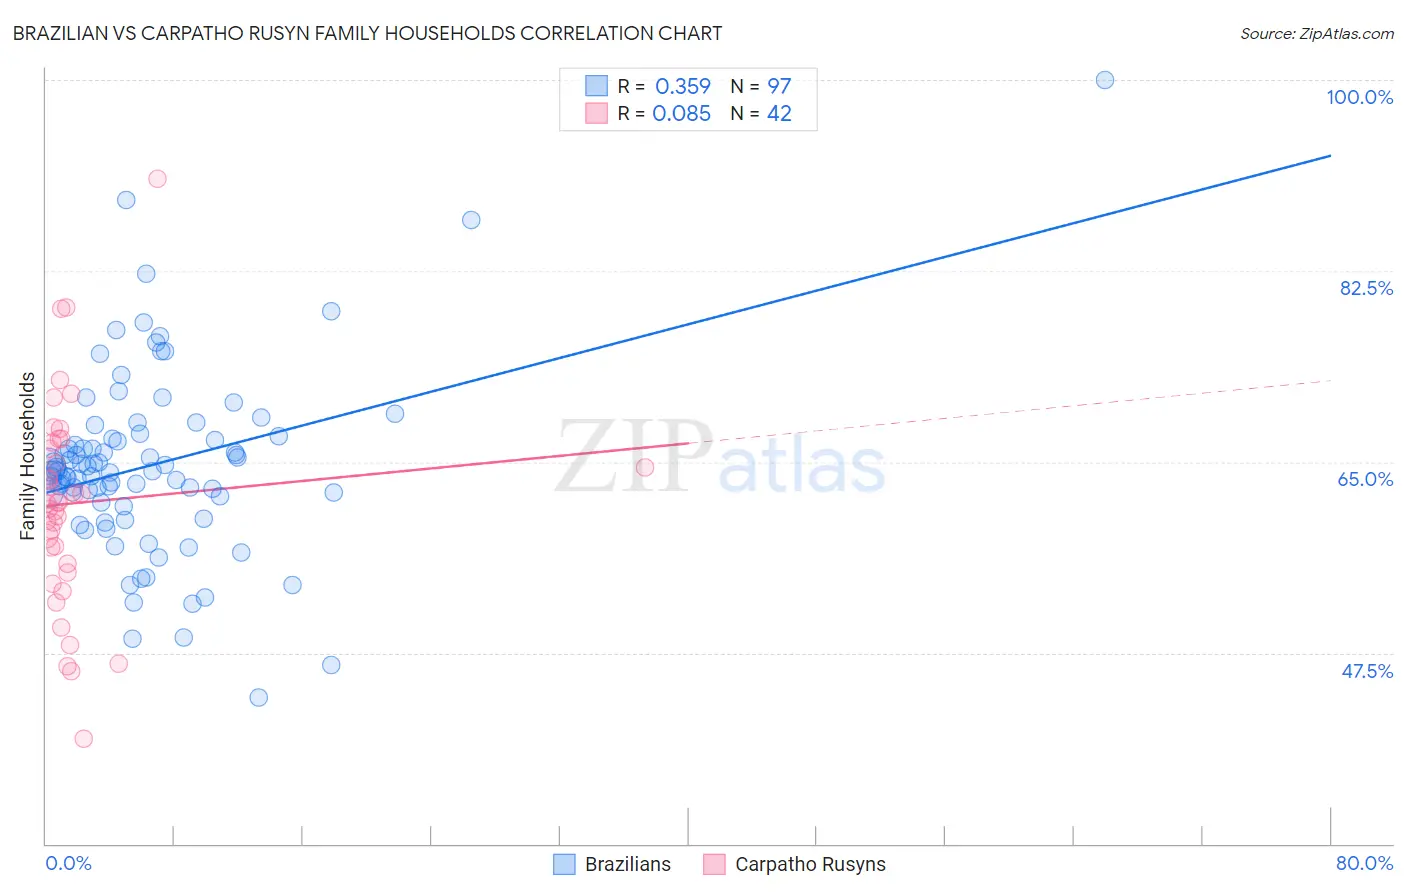
Brazilian vs Carpatho Rusyn Family Households Correlation Chart
The statistical analysis conducted on geographies consisting of 323,732,843 people shows a mild positive correlation between the proportion of Brazilians and percentage of family households in the United States with a correlation coefficient (R) of 0.359 and weighted average of 63.9%. Similarly, the statistical analysis conducted on geographies consisting of 58,871,690 people shows a slight positive correlation between the proportion of Carpatho Rusyns and percentage of family households in the United States with a correlation coefficient (R) of 0.085 and weighted average of 61.1%, a difference of 4.6%.
Family Households Correlation Summary
| Measurement | Brazilian | Carpatho Rusyn |
| Minimum | 43.4% | 39.6% |
| Maximum | 100.0% | 91.0% |
| Range | 56.6% | 51.3% |
| Mean | 64.7% | 61.2% |
| Median | 64.2% | 61.2% |
| Interquartile 25% (IQ1) | 61.5% | 55.7% |
| Interquartile 75% (IQ3) | 67.3% | 66.8% |
| Interquartile Range (IQR) | 5.8% | 11.1% |
| Standard Deviation (Sample) | 8.5% | 9.7% |
| Standard Deviation (Population) | 8.4% | 9.6% |
Similar Demographics by Family Households
Demographics Similar to Brazilians by Family Households
In terms of family households, the demographic groups most similar to Brazilians are Immigrants from Uruguay (63.9%, a difference of 0.010%), Immigrants from Lithuania (63.9%, a difference of 0.010%), Iranian (63.9%, a difference of 0.030%), Norwegian (63.9%, a difference of 0.030%), and Nigerian (63.9%, a difference of 0.030%).
| Demographics | Rating | Rank | Family Households |
| Poles | 18.9 /100 | #198 | Poor 64.0% |
| Slavs | 18.6 /100 | #199 | Poor 64.0% |
| Immigrants | Malaysia | 17.9 /100 | #200 | Poor 64.0% |
| Immigrants | Eastern Europe | 17.2 /100 | #201 | Poor 64.0% |
| Iranians | 13.5 /100 | #202 | Poor 63.9% |
| Norwegians | 13.2 /100 | #203 | Poor 63.9% |
| Immigrants | Uruguay | 12.8 /100 | #204 | Poor 63.9% |
| Brazilians | 12.4 /100 | #205 | Poor 63.9% |
| Immigrants | Lithuania | 12.1 /100 | #206 | Poor 63.9% |
| Nigerians | 11.5 /100 | #207 | Poor 63.9% |
| Immigrants | Bangladesh | 11.4 /100 | #208 | Poor 63.9% |
| Sierra Leoneans | 11.2 /100 | #209 | Poor 63.9% |
| Immigrants | Thailand | 9.6 /100 | #210 | Tragic 63.8% |
| Shoshone | 9.4 /100 | #211 | Tragic 63.8% |
| Immigrants | Netherlands | 9.4 /100 | #212 | Tragic 63.8% |
Demographics Similar to Carpatho Rusyns by Family Households
In terms of family households, the demographic groups most similar to Carpatho Rusyns are Immigrants from Eastern Africa (61.1%, a difference of 0.12%), Immigrants from Ethiopia (61.2%, a difference of 0.20%), Ethiopian (61.2%, a difference of 0.28%), German Russian (60.9%, a difference of 0.28%), and Soviet Union (60.9%, a difference of 0.28%).
| Demographics | Rating | Rank | Family Households |
| Kiowa | 0.0 /100 | #328 | Tragic 61.4% |
| Cambodians | 0.0 /100 | #329 | Tragic 61.4% |
| Immigrants | Australia | 0.0 /100 | #330 | Tragic 61.3% |
| Immigrants | France | 0.0 /100 | #331 | Tragic 61.3% |
| Ethiopians | 0.0 /100 | #332 | Tragic 61.2% |
| Immigrants | Ethiopia | 0.0 /100 | #333 | Tragic 61.2% |
| Immigrants | Eastern Africa | 0.0 /100 | #334 | Tragic 61.1% |
| Carpatho Rusyns | 0.0 /100 | #335 | Tragic 61.1% |
| German Russians | 0.0 /100 | #336 | Tragic 60.9% |
| Soviet Union | 0.0 /100 | #337 | Tragic 60.9% |
| Immigrants | Eritrea | 0.0 /100 | #338 | Tragic 60.8% |
| Immigrants | Saudi Arabia | 0.0 /100 | #339 | Tragic 60.7% |
| Immigrants | Sudan | 0.0 /100 | #340 | Tragic 60.2% |
| Immigrants | Senegal | 0.0 /100 | #341 | Tragic 60.1% |
| Sudanese | 0.0 /100 | #342 | Tragic 60.0% |