Potawatomi vs Immigrants from Ethiopia Divorced or Separated
COMPARE
Potawatomi
Immigrants from Ethiopia
Divorced or Separated
Divorced or Separated Comparison
Potawatomi
Immigrants from Ethiopia
13.5%
DIVORCED OR SEPARATED
0.0/ 100
METRIC RATING
325th/ 347
METRIC RANK
12.1%
DIVORCED OR SEPARATED
43.1/ 100
METRIC RATING
182nd/ 347
METRIC RANK
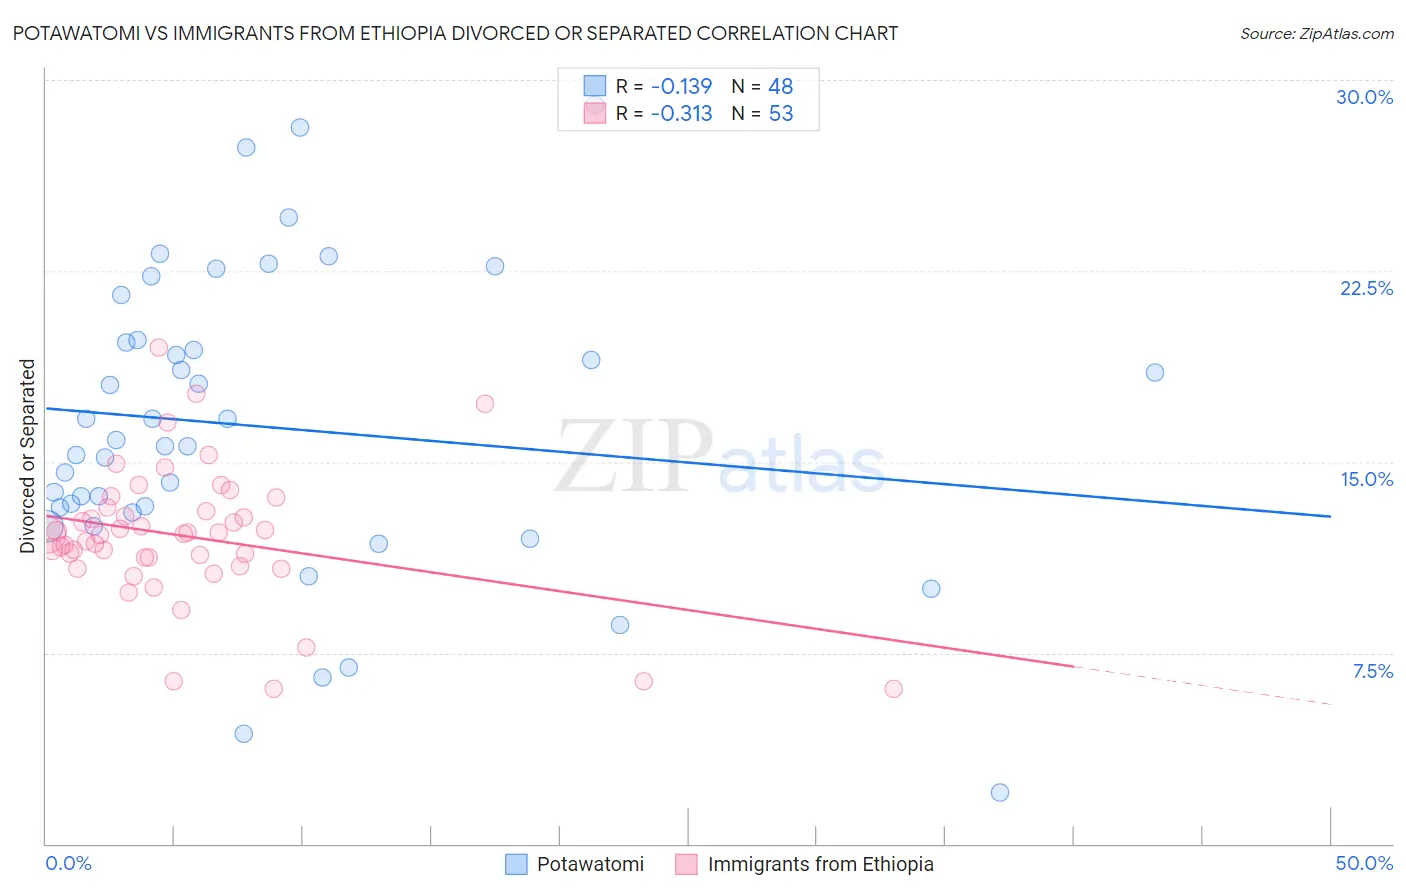
Potawatomi vs Immigrants from Ethiopia Divorced or Separated Correlation Chart
The statistical analysis conducted on geographies consisting of 117,768,294 people shows a poor negative correlation between the proportion of Potawatomi and percentage of population currently divorced or separated in the United States with a correlation coefficient (R) of -0.139 and weighted average of 13.5%. Similarly, the statistical analysis conducted on geographies consisting of 211,499,427 people shows a mild negative correlation between the proportion of Immigrants from Ethiopia and percentage of population currently divorced or separated in the United States with a correlation coefficient (R) of -0.313 and weighted average of 12.1%, a difference of 11.4%.
Divorced or Separated Correlation Summary
| Measurement | Potawatomi | Immigrants from Ethiopia |
| Minimum | 2.0% | 6.1% |
| Maximum | 29.0% | 19.5% |
| Range | 27.0% | 13.4% |
| Mean | 16.4% | 12.1% |
| Median | 15.7% | 12.1% |
| Interquartile 25% (IQ1) | 13.1% | 11.1% |
| Interquartile 75% (IQ3) | 19.7% | 13.2% |
| Interquartile Range (IQR) | 6.6% | 2.1% |
| Standard Deviation (Sample) | 5.9% | 2.7% |
| Standard Deviation (Population) | 5.8% | 2.6% |
Similar Demographics by Divorced or Separated
Demographics Similar to Potawatomi by Divorced or Separated
In terms of divorced or separated, the demographic groups most similar to Potawatomi are Immigrants from Congo (13.5%, a difference of 0.010%), Osage (13.4%, a difference of 0.060%), U.S. Virgin Islander (13.4%, a difference of 0.13%), Immigrants from Haiti (13.4%, a difference of 0.35%), and Comanche (13.5%, a difference of 0.49%).
| Demographics | Rating | Rank | Divorced or Separated |
| Cree | 0.0 /100 | #318 | Tragic 13.4% |
| Puget Sound Salish | 0.0 /100 | #319 | Tragic 13.4% |
| Cajuns | 0.0 /100 | #320 | Tragic 13.4% |
| Cheyenne | 0.0 /100 | #321 | Tragic 13.4% |
| Immigrants | Haiti | 0.0 /100 | #322 | Tragic 13.4% |
| U.S. Virgin Islanders | 0.0 /100 | #323 | Tragic 13.4% |
| Osage | 0.0 /100 | #324 | Tragic 13.4% |
| Potawatomi | 0.0 /100 | #325 | Tragic 13.5% |
| Immigrants | Congo | 0.0 /100 | #326 | Tragic 13.5% |
| Comanche | 0.0 /100 | #327 | Tragic 13.5% |
| Immigrants | Caribbean | 0.0 /100 | #328 | Tragic 13.6% |
| Houma | 0.0 /100 | #329 | Tragic 13.6% |
| Paiute | 0.0 /100 | #330 | Tragic 13.6% |
| Blacks/African Americans | 0.0 /100 | #331 | Tragic 13.6% |
| Cherokee | 0.0 /100 | #332 | Tragic 13.7% |
Demographics Similar to Immigrants from Ethiopia by Divorced or Separated
In terms of divorced or separated, the demographic groups most similar to Immigrants from Ethiopia are Immigrants from Central America (12.1%, a difference of 0.010%), Immigrants from Canada (12.1%, a difference of 0.030%), Barbadian (12.1%, a difference of 0.070%), Immigrants from North America (12.1%, a difference of 0.070%), and Immigrants from Western Europe (12.1%, a difference of 0.090%).
| Demographics | Rating | Rank | Divorced or Separated |
| Immigrants | Sierra Leone | 50.0 /100 | #175 | Average 12.1% |
| Pennsylvania Germans | 48.9 /100 | #176 | Average 12.1% |
| Brazilians | 47.7 /100 | #177 | Average 12.1% |
| Ghanaians | 45.9 /100 | #178 | Average 12.1% |
| Immigrants | Western Europe | 45.6 /100 | #179 | Average 12.1% |
| Barbadians | 45.0 /100 | #180 | Average 12.1% |
| Immigrants | Canada | 44.0 /100 | #181 | Average 12.1% |
| Immigrants | Ethiopia | 43.1 /100 | #182 | Average 12.1% |
| Immigrants | Central America | 42.9 /100 | #183 | Average 12.1% |
| Immigrants | North America | 41.1 /100 | #184 | Average 12.1% |
| Immigrants | Nigeria | 40.5 /100 | #185 | Average 12.1% |
| Immigrants | Chile | 39.0 /100 | #186 | Fair 12.1% |
| Belizeans | 37.7 /100 | #187 | Fair 12.1% |
| Immigrants | Belize | 37.6 /100 | #188 | Fair 12.1% |
| Sierra Leoneans | 35.5 /100 | #189 | Fair 12.1% |