Potawatomi vs Pueblo Single Mother Households
COMPARE
Potawatomi
Pueblo
Single Mother Households
Single Mother Households Comparison
Potawatomi
Pueblo
6.6%
SINGLE MOTHER HOUSEHOLDS
15.5/ 100
METRIC RATING
199th/ 347
METRIC RANK
7.4%
SINGLE MOTHER HOUSEHOLDS
0.2/ 100
METRIC RATING
258th/ 347
METRIC RANK
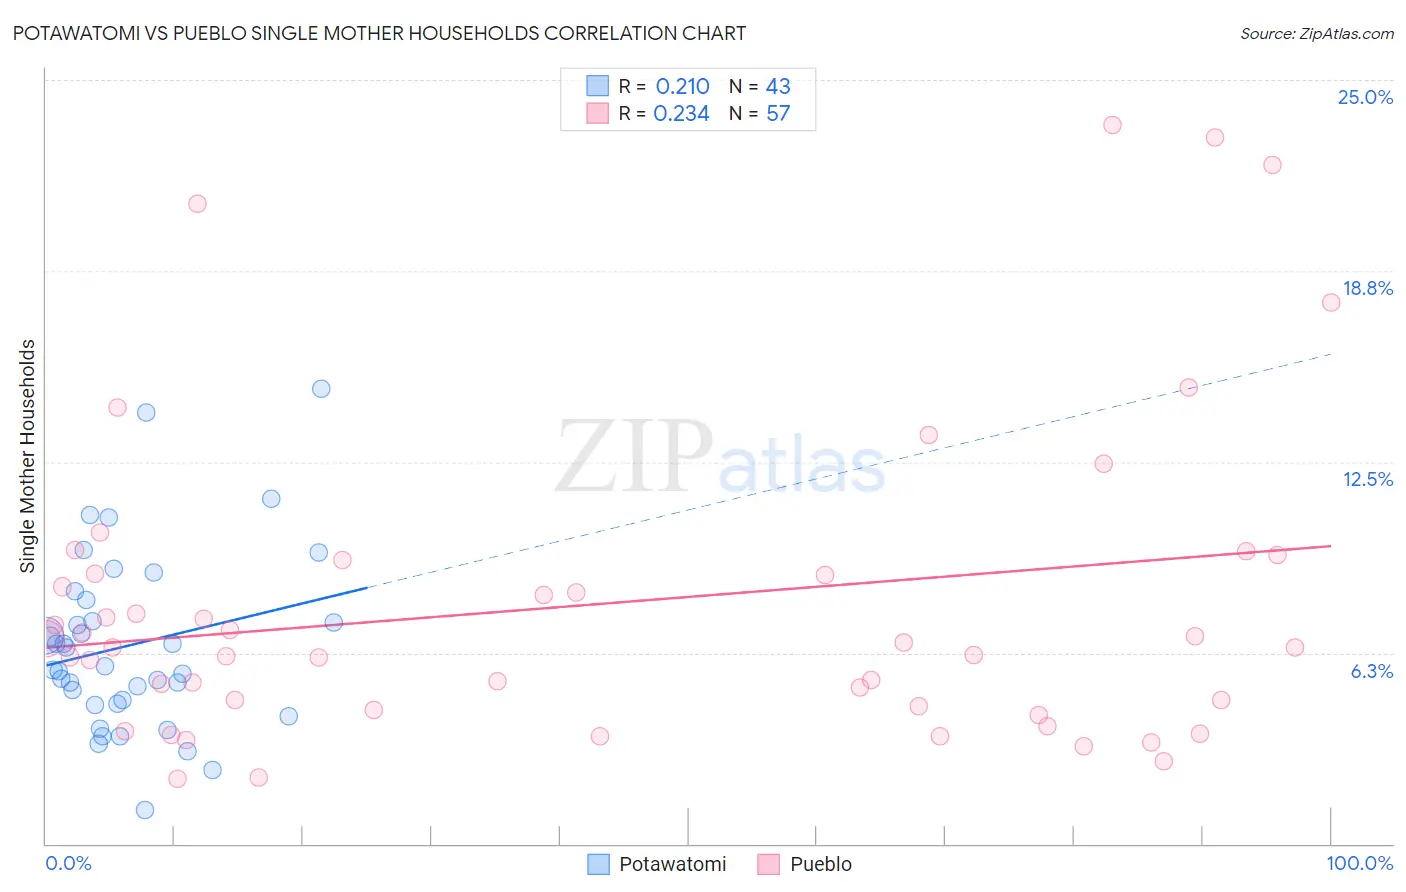
Potawatomi vs Pueblo Single Mother Households Correlation Chart
The statistical analysis conducted on geographies consisting of 117,659,768 people shows a weak positive correlation between the proportion of Potawatomi and percentage of single mother households in the United States with a correlation coefficient (R) of 0.210 and weighted average of 6.6%. Similarly, the statistical analysis conducted on geographies consisting of 119,909,438 people shows a weak positive correlation between the proportion of Pueblo and percentage of single mother households in the United States with a correlation coefficient (R) of 0.234 and weighted average of 7.4%, a difference of 12.0%.
Single Mother Households Correlation Summary
| Measurement | Potawatomi | Pueblo |
| Minimum | 1.1% | 2.1% |
| Maximum | 14.9% | 23.5% |
| Range | 13.8% | 21.4% |
| Mean | 6.5% | 7.8% |
| Median | 5.8% | 6.4% |
| Interquartile 25% (IQ1) | 4.6% | 4.4% |
| Interquartile 75% (IQ3) | 8.0% | 9.1% |
| Interquartile Range (IQR) | 3.4% | 4.6% |
| Standard Deviation (Sample) | 2.9% | 5.2% |
| Standard Deviation (Population) | 2.9% | 5.1% |
Similar Demographics by Single Mother Households
Demographics Similar to Potawatomi by Single Mother Households
In terms of single mother households, the demographic groups most similar to Potawatomi are Hawaiian (6.6%, a difference of 0.11%), Immigrants from Ethiopia (6.6%, a difference of 0.16%), Moroccan (6.6%, a difference of 0.36%), South American (6.6%, a difference of 0.47%), and Uruguayan (6.6%, a difference of 0.47%).
| Demographics | Rating | Rank | Single Mother Households |
| Americans | 19.0 /100 | #192 | Poor 6.6% |
| Colombians | 18.3 /100 | #193 | Poor 6.6% |
| Immigrants | Uganda | 18.3 /100 | #194 | Poor 6.6% |
| South Americans | 18.0 /100 | #195 | Poor 6.6% |
| Uruguayans | 18.0 /100 | #196 | Poor 6.6% |
| Moroccans | 17.4 /100 | #197 | Poor 6.6% |
| Hawaiians | 16.1 /100 | #198 | Poor 6.6% |
| Potawatomi | 15.5 /100 | #199 | Poor 6.6% |
| Immigrants | Ethiopia | 14.7 /100 | #200 | Poor 6.6% |
| Venezuelans | 12.9 /100 | #201 | Poor 6.6% |
| Guamanians/Chamorros | 12.4 /100 | #202 | Poor 6.6% |
| Immigrants | Peru | 12.0 /100 | #203 | Poor 6.7% |
| Immigrants | Fiji | 11.9 /100 | #204 | Poor 6.7% |
| Cree | 11.9 /100 | #205 | Poor 6.7% |
| German Russians | 11.5 /100 | #206 | Poor 6.7% |
Demographics Similar to Pueblo by Single Mother Households
In terms of single mother households, the demographic groups most similar to Pueblo are Alaska Native (7.4%, a difference of 0.020%), Immigrants from Yemen (7.4%, a difference of 0.020%), Seminole (7.4%, a difference of 0.060%), Immigrants from Zaire (7.4%, a difference of 0.060%), and Japanese (7.4%, a difference of 0.080%).
| Demographics | Rating | Rank | Single Mother Households |
| Malaysians | 0.3 /100 | #251 | Tragic 7.3% |
| Alaskan Athabascans | 0.3 /100 | #252 | Tragic 7.3% |
| Cajuns | 0.3 /100 | #253 | Tragic 7.3% |
| Immigrants | Ecuador | 0.3 /100 | #254 | Tragic 7.3% |
| Mexican American Indians | 0.2 /100 | #255 | Tragic 7.4% |
| Seminole | 0.2 /100 | #256 | Tragic 7.4% |
| Alaska Natives | 0.2 /100 | #257 | Tragic 7.4% |
| Pueblo | 0.2 /100 | #258 | Tragic 7.4% |
| Immigrants | Yemen | 0.2 /100 | #259 | Tragic 7.4% |
| Immigrants | Zaire | 0.2 /100 | #260 | Tragic 7.4% |
| Japanese | 0.2 /100 | #261 | Tragic 7.4% |
| Immigrants | Somalia | 0.2 /100 | #262 | Tragic 7.4% |
| Immigrants | Nicaragua | 0.2 /100 | #263 | Tragic 7.4% |
| Yaqui | 0.1 /100 | #264 | Tragic 7.4% |
| Crow | 0.1 /100 | #265 | Tragic 7.4% |