Portuguese vs Japanese Family Households with Children
COMPARE
Portuguese
Japanese
Family Households with Children
Family Households with Children Comparison
Portuguese
Japanese
27.6%
FAMILY HOUSEHOLDS WITH CHILDREN
77.8/ 100
METRIC RATING
151st/ 347
METRIC RANK
29.4%
FAMILY HOUSEHOLDS WITH CHILDREN
100.0/ 100
METRIC RATING
31st/ 347
METRIC RANK
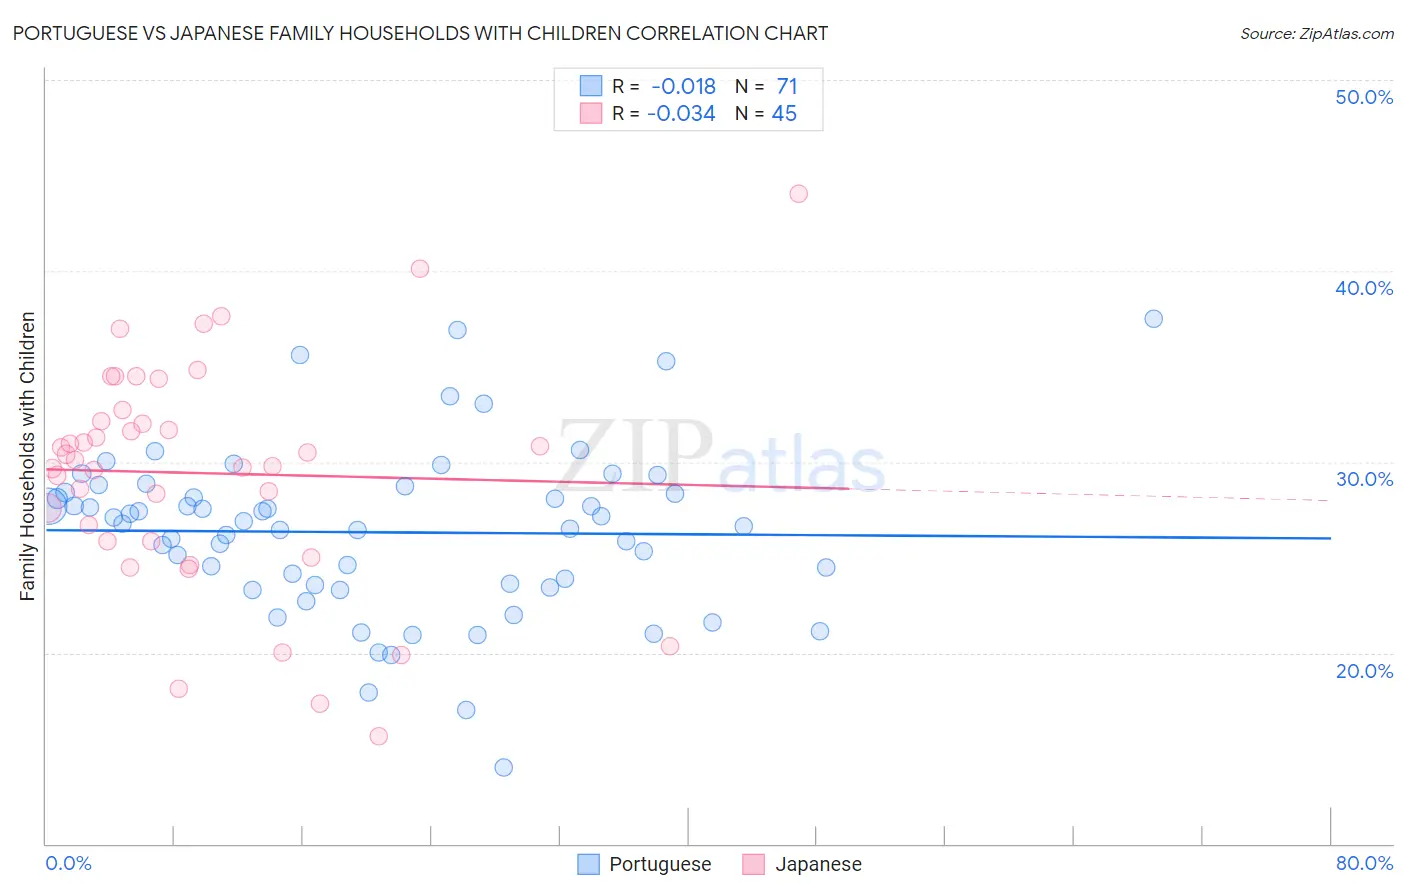
Portuguese vs Japanese Family Households with Children Correlation Chart
The statistical analysis conducted on geographies consisting of 449,747,552 people shows no correlation between the proportion of Portuguese and percentage of family households with children in the United States with a correlation coefficient (R) of -0.018 and weighted average of 27.6%. Similarly, the statistical analysis conducted on geographies consisting of 249,052,059 people shows no correlation between the proportion of Japanese and percentage of family households with children in the United States with a correlation coefficient (R) of -0.034 and weighted average of 29.4%, a difference of 6.5%.
Family Households with Children Correlation Summary
| Measurement | Portuguese | Japanese |
| Minimum | 14.0% | 15.6% |
| Maximum | 37.5% | 44.0% |
| Range | 23.5% | 28.4% |
| Mean | 26.3% | 29.4% |
| Median | 26.7% | 30.1% |
| Interquartile 25% (IQ1) | 23.5% | 25.8% |
| Interquartile 75% (IQ3) | 28.4% | 32.4% |
| Interquartile Range (IQR) | 4.9% | 6.6% |
| Standard Deviation (Sample) | 4.4% | 5.9% |
| Standard Deviation (Population) | 4.3% | 5.9% |
Similar Demographics by Family Households with Children
Demographics Similar to Portuguese by Family Households with Children
In terms of family households with children, the demographic groups most similar to Portuguese are Argentinean (27.6%, a difference of 0.020%), Ethiopian (27.6%, a difference of 0.030%), Immigrants from Moldova (27.6%, a difference of 0.040%), Osage (27.6%, a difference of 0.040%), and Menominee (27.6%, a difference of 0.040%).
| Demographics | Rating | Rank | Family Households with Children |
| Brazilians | 79.6 /100 | #144 | Good 27.7% |
| Immigrants | Chile | 79.5 /100 | #145 | Good 27.7% |
| Basques | 79.5 /100 | #146 | Good 27.7% |
| Immigrants | Moldova | 79.1 /100 | #147 | Good 27.6% |
| Osage | 79.0 /100 | #148 | Good 27.6% |
| Menominee | 78.9 /100 | #149 | Good 27.6% |
| Argentineans | 78.5 /100 | #150 | Good 27.6% |
| Portuguese | 77.8 /100 | #151 | Good 27.6% |
| Ethiopians | 77.0 /100 | #152 | Good 27.6% |
| Immigrants | Cabo Verde | 75.6 /100 | #153 | Good 27.6% |
| Icelanders | 75.3 /100 | #154 | Good 27.6% |
| Comanche | 74.8 /100 | #155 | Good 27.6% |
| Hungarians | 74.6 /100 | #156 | Good 27.6% |
| Indians (Asian) | 71.6 /100 | #157 | Good 27.6% |
| Romanians | 70.8 /100 | #158 | Good 27.6% |
Demographics Similar to Japanese by Family Households with Children
In terms of family households with children, the demographic groups most similar to Japanese are Immigrants from Yemen (29.4%, a difference of 0.060%), Yuman (29.5%, a difference of 0.14%), Samoan (29.5%, a difference of 0.18%), Bolivian (29.5%, a difference of 0.18%), and Venezuelan (29.4%, a difference of 0.26%).
| Demographics | Rating | Rank | Family Households with Children |
| Guamanians/Chamorros | 100.0 /100 | #24 | Exceptional 29.7% |
| Immigrants | Latin America | 100.0 /100 | #25 | Exceptional 29.7% |
| Sri Lankans | 100.0 /100 | #26 | Exceptional 29.5% |
| Immigrants | Vietnam | 100.0 /100 | #27 | Exceptional 29.5% |
| Samoans | 100.0 /100 | #28 | Exceptional 29.5% |
| Bolivians | 100.0 /100 | #29 | Exceptional 29.5% |
| Yuman | 100.0 /100 | #30 | Exceptional 29.5% |
| Japanese | 100.0 /100 | #31 | Exceptional 29.4% |
| Immigrants | Yemen | 100.0 /100 | #32 | Exceptional 29.4% |
| Venezuelans | 100.0 /100 | #33 | Exceptional 29.4% |
| Immigrants | Bolivia | 100.0 /100 | #34 | Exceptional 29.3% |
| Immigrants | Sierra Leone | 100.0 /100 | #35 | Exceptional 29.3% |
| Immigrants | Venezuela | 100.0 /100 | #36 | Exceptional 29.3% |
| Immigrants | Cameroon | 100.0 /100 | #37 | Exceptional 29.2% |
| Koreans | 100.0 /100 | #38 | Exceptional 29.2% |