Zimbabwean vs Japanese Family Households with Children
COMPARE
Zimbabwean
Japanese
Family Households with Children
Family Households with Children Comparison
Zimbabweans
Japanese
27.9%
FAMILY HOUSEHOLDS WITH CHILDREN
95.6/ 100
METRIC RATING
119th/ 347
METRIC RANK
29.4%
FAMILY HOUSEHOLDS WITH CHILDREN
100.0/ 100
METRIC RATING
31st/ 347
METRIC RANK
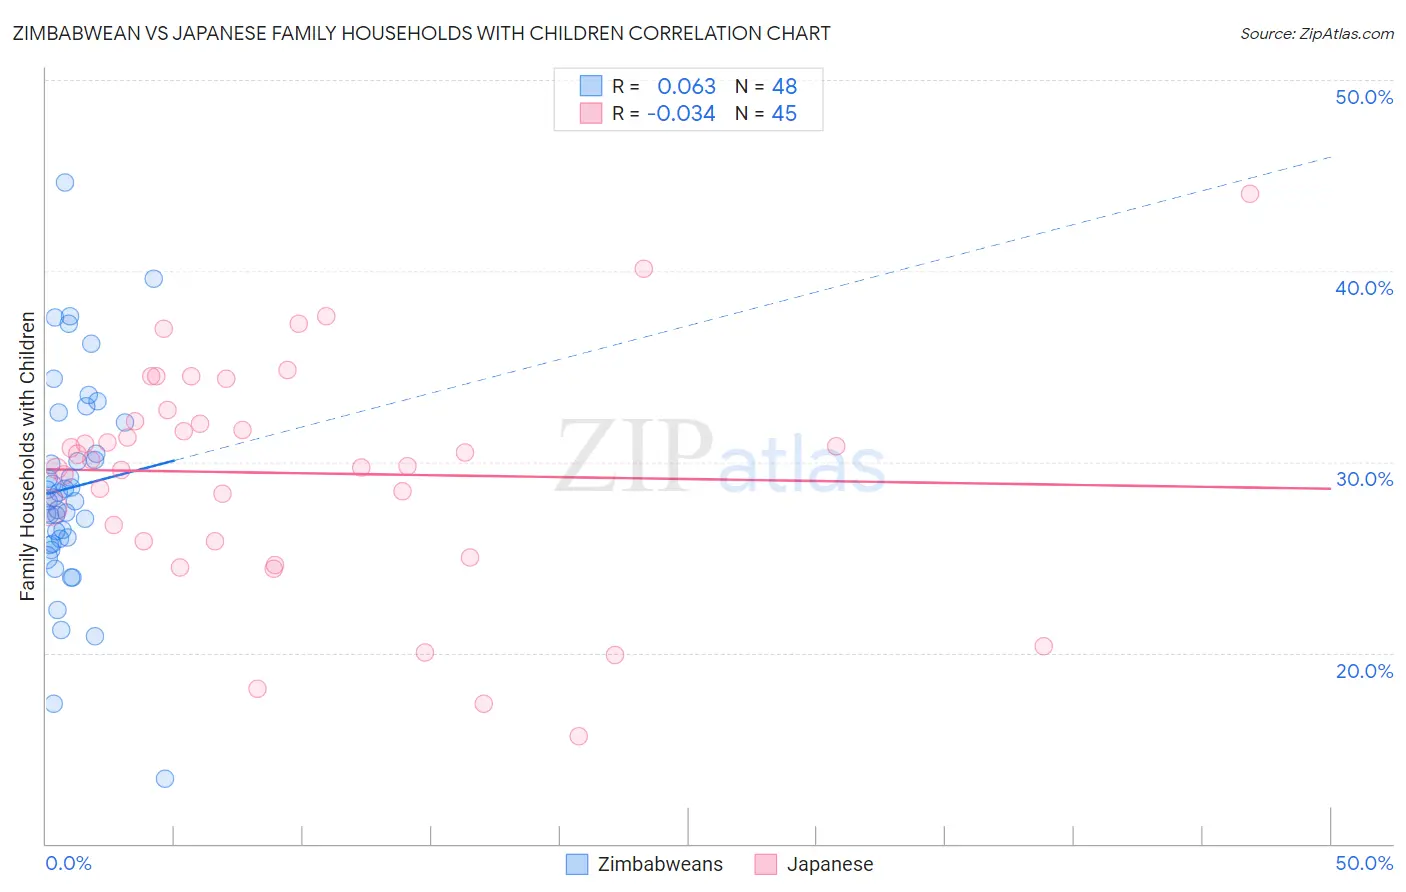
Zimbabwean vs Japanese Family Households with Children Correlation Chart
The statistical analysis conducted on geographies consisting of 69,170,412 people shows a slight positive correlation between the proportion of Zimbabweans and percentage of family households with children in the United States with a correlation coefficient (R) of 0.063 and weighted average of 27.9%. Similarly, the statistical analysis conducted on geographies consisting of 249,052,059 people shows no correlation between the proportion of Japanese and percentage of family households with children in the United States with a correlation coefficient (R) of -0.034 and weighted average of 29.4%, a difference of 5.5%.
Family Households with Children Correlation Summary
| Measurement | Zimbabwean | Japanese |
| Minimum | 13.4% | 15.6% |
| Maximum | 44.7% | 44.0% |
| Range | 31.3% | 28.4% |
| Mean | 28.6% | 29.4% |
| Median | 28.1% | 30.1% |
| Interquartile 25% (IQ1) | 25.8% | 25.8% |
| Interquartile 75% (IQ3) | 31.3% | 32.4% |
| Interquartile Range (IQR) | 5.4% | 6.6% |
| Standard Deviation (Sample) | 5.6% | 5.9% |
| Standard Deviation (Population) | 5.5% | 5.9% |
Similar Demographics by Family Households with Children
Demographics Similar to Zimbabweans by Family Households with Children
In terms of family households with children, the demographic groups most similar to Zimbabweans are European (27.9%, a difference of 0.030%), Immigrants from Malaysia (27.9%, a difference of 0.040%), Central American Indian (27.9%, a difference of 0.040%), Pakistani (27.9%, a difference of 0.050%), and Immigrants from Africa (28.0%, a difference of 0.18%).
| Demographics | Rating | Rank | Family Households with Children |
| Immigrants | Middle Africa | 97.0 /100 | #112 | Exceptional 28.0% |
| Arabs | 97.0 /100 | #113 | Exceptional 28.0% |
| South American Indians | 96.9 /100 | #114 | Exceptional 28.0% |
| Immigrants | Africa | 96.8 /100 | #115 | Exceptional 28.0% |
| Pakistanis | 96.0 /100 | #116 | Exceptional 27.9% |
| Immigrants | Malaysia | 95.9 /100 | #117 | Exceptional 27.9% |
| Central American Indians | 95.9 /100 | #118 | Exceptional 27.9% |
| Zimbabweans | 95.6 /100 | #119 | Exceptional 27.9% |
| Europeans | 95.4 /100 | #120 | Exceptional 27.9% |
| Immigrants | Western Asia | 93.6 /100 | #121 | Exceptional 27.9% |
| Immigrants | Zimbabwe | 92.8 /100 | #122 | Exceptional 27.8% |
| Immigrants | Northern Africa | 91.8 /100 | #123 | Exceptional 27.8% |
| Immigrants | Singapore | 90.8 /100 | #124 | Exceptional 27.8% |
| Ecuadorians | 90.8 /100 | #125 | Exceptional 27.8% |
| Immigrants | Ethiopia | 90.5 /100 | #126 | Exceptional 27.8% |
Demographics Similar to Japanese by Family Households with Children
In terms of family households with children, the demographic groups most similar to Japanese are Immigrants from Yemen (29.4%, a difference of 0.060%), Yuman (29.5%, a difference of 0.14%), Samoan (29.5%, a difference of 0.18%), Bolivian (29.5%, a difference of 0.18%), and Venezuelan (29.4%, a difference of 0.26%).
| Demographics | Rating | Rank | Family Households with Children |
| Guamanians/Chamorros | 100.0 /100 | #24 | Exceptional 29.7% |
| Immigrants | Latin America | 100.0 /100 | #25 | Exceptional 29.7% |
| Sri Lankans | 100.0 /100 | #26 | Exceptional 29.5% |
| Immigrants | Vietnam | 100.0 /100 | #27 | Exceptional 29.5% |
| Samoans | 100.0 /100 | #28 | Exceptional 29.5% |
| Bolivians | 100.0 /100 | #29 | Exceptional 29.5% |
| Yuman | 100.0 /100 | #30 | Exceptional 29.5% |
| Japanese | 100.0 /100 | #31 | Exceptional 29.4% |
| Immigrants | Yemen | 100.0 /100 | #32 | Exceptional 29.4% |
| Venezuelans | 100.0 /100 | #33 | Exceptional 29.4% |
| Immigrants | Bolivia | 100.0 /100 | #34 | Exceptional 29.3% |
| Immigrants | Sierra Leone | 100.0 /100 | #35 | Exceptional 29.3% |
| Immigrants | Venezuela | 100.0 /100 | #36 | Exceptional 29.3% |
| Immigrants | Cameroon | 100.0 /100 | #37 | Exceptional 29.2% |
| Koreans | 100.0 /100 | #38 | Exceptional 29.2% |