Immigrants from Western Europe vs Immigrants from Europe Average Family Size
COMPARE
Immigrants from Western Europe
Immigrants from Europe
Average Family Size
Average Family Size Comparison
Immigrants from Western Europe
Immigrants from Europe
3.14
AVERAGE FAMILY SIZE
0.2/ 100
METRIC RATING
297th/ 347
METRIC RANK
3.15
AVERAGE FAMILY SIZE
0.5/ 100
METRIC RATING
279th/ 347
METRIC RANK
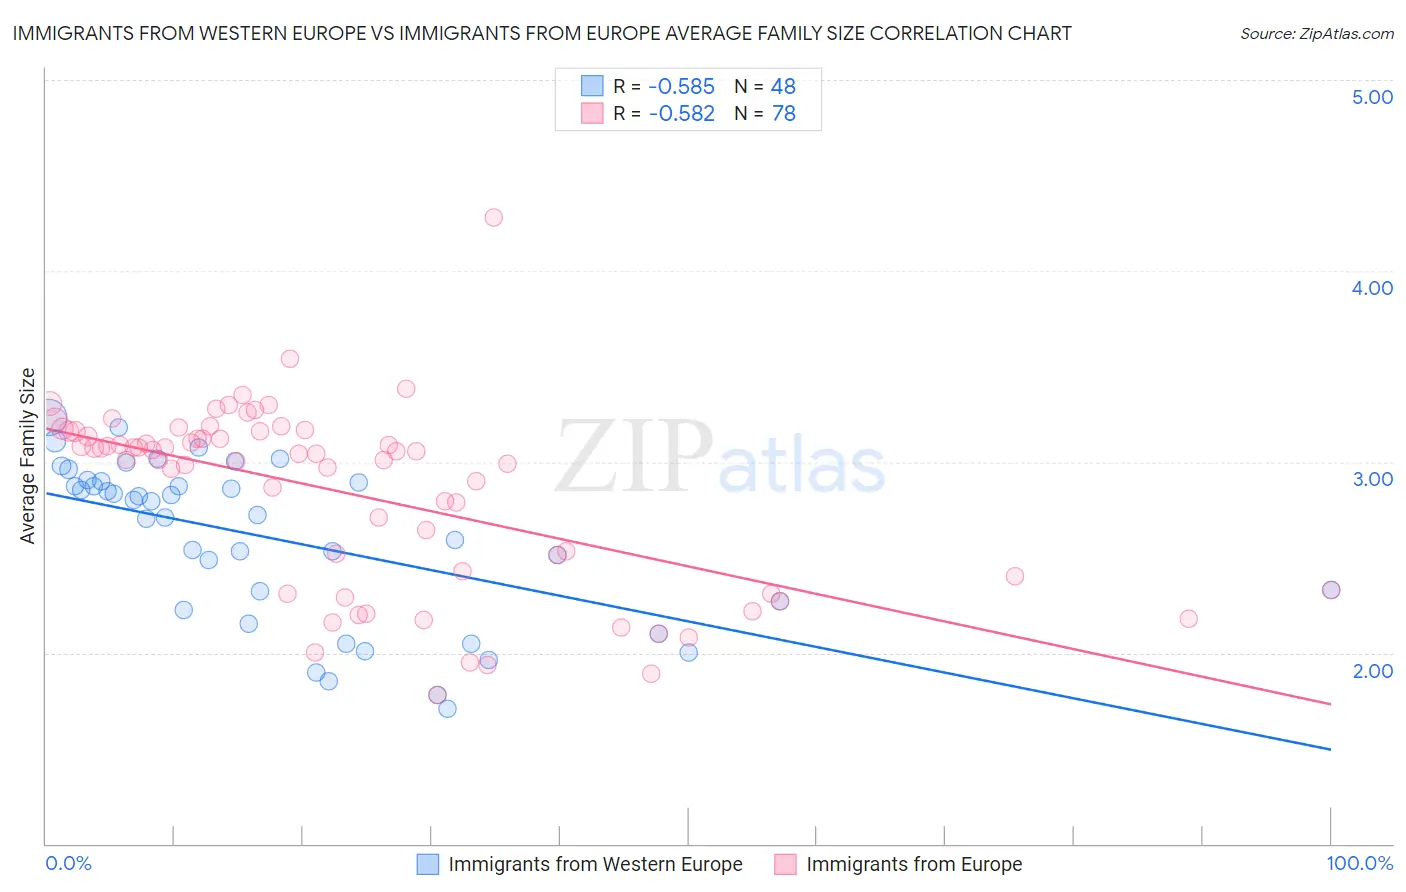
Immigrants from Western Europe vs Immigrants from Europe Average Family Size Correlation Chart
The statistical analysis conducted on geographies consisting of 493,828,171 people shows a substantial negative correlation between the proportion of Immigrants from Western Europe and average family size in the United States with a correlation coefficient (R) of -0.585 and weighted average of 3.14. Similarly, the statistical analysis conducted on geographies consisting of 546,902,968 people shows a substantial negative correlation between the proportion of Immigrants from Europe and average family size in the United States with a correlation coefficient (R) of -0.582 and weighted average of 3.15, a difference of 0.34%.
Average Family Size Correlation Summary
| Measurement | Immigrants from Western Europe | Immigrants from Europe |
| Minimum | 1.71 | 1.78 |
| Maximum | 3.23 | 4.28 |
| Range | 1.52 | 2.50 |
| Mean | 2.59 | 2.84 |
| Median | 2.76 | 3.04 |
| Interquartile 25% (IQ1) | 2.25 | 2.40 |
| Interquartile 75% (IQ3) | 2.89 | 3.16 |
| Interquartile Range (IQR) | 0.65 | 0.76 |
| Standard Deviation (Sample) | 0.42 | 0.48 |
| Standard Deviation (Population) | 0.41 | 0.47 |
Demographics Similar to Immigrants from Western Europe and Immigrants from Europe by Average Family Size
In terms of average family size, the demographic groups most similar to Immigrants from Western Europe are Austrian (3.14, a difference of 0.0%), Ukrainian (3.14, a difference of 0.0%), Colville (3.14, a difference of 0.0%), Immigrants from Croatia (3.14, a difference of 0.010%), and Scandinavian (3.14, a difference of 0.030%). Similarly, the demographic groups most similar to Immigrants from Europe are Okinawan (3.15, a difference of 0.020%), Immigrants from England (3.15, a difference of 0.030%), Immigrants from Denmark (3.15, a difference of 0.060%), Yugoslavian (3.15, a difference of 0.070%), and German Russian (3.15, a difference of 0.080%).
| Demographics | Rating | Rank | Average Family Size |
| Okinawans | 0.5 /100 | #278 | Tragic 3.15 |
| Immigrants | Europe | 0.5 /100 | #279 | Tragic 3.15 |
| Immigrants | England | 0.4 /100 | #280 | Tragic 3.15 |
| Immigrants | Denmark | 0.4 /100 | #281 | Tragic 3.15 |
| Yugoslavians | 0.4 /100 | #282 | Tragic 3.15 |
| German Russians | 0.4 /100 | #283 | Tragic 3.15 |
| Immigrants | France | 0.4 /100 | #284 | Tragic 3.15 |
| Whites/Caucasians | 0.3 /100 | #285 | Tragic 3.14 |
| Immigrants | Netherlands | 0.3 /100 | #286 | Tragic 3.14 |
| Greeks | 0.3 /100 | #287 | Tragic 3.14 |
| Immigrants | Czechoslovakia | 0.3 /100 | #288 | Tragic 3.14 |
| Immigrants | Norway | 0.3 /100 | #289 | Tragic 3.14 |
| Cypriots | 0.3 /100 | #290 | Tragic 3.14 |
| Alsatians | 0.2 /100 | #291 | Tragic 3.14 |
| Europeans | 0.2 /100 | #292 | Tragic 3.14 |
| Scandinavians | 0.2 /100 | #293 | Tragic 3.14 |
| Immigrants | Croatia | 0.2 /100 | #294 | Tragic 3.14 |
| Austrians | 0.2 /100 | #295 | Tragic 3.14 |
| Ukrainians | 0.2 /100 | #296 | Tragic 3.14 |
| Immigrants | Western Europe | 0.2 /100 | #297 | Tragic 3.14 |
| Colville | 0.2 /100 | #298 | Tragic 3.14 |