Immigrants from Peru vs Norwegian Married-couple Households
COMPARE
Immigrants from Peru
Norwegian
Married-couple Households
Married-couple Households Comparison
Immigrants from Peru
Norwegians
47.3%
MARRIED-COUPLE HOUSEHOLDS
87.9/ 100
METRIC RATING
128th/ 347
METRIC RANK
49.5%
MARRIED-COUPLE HOUSEHOLDS
99.9/ 100
METRIC RATING
21st/ 347
METRIC RANK
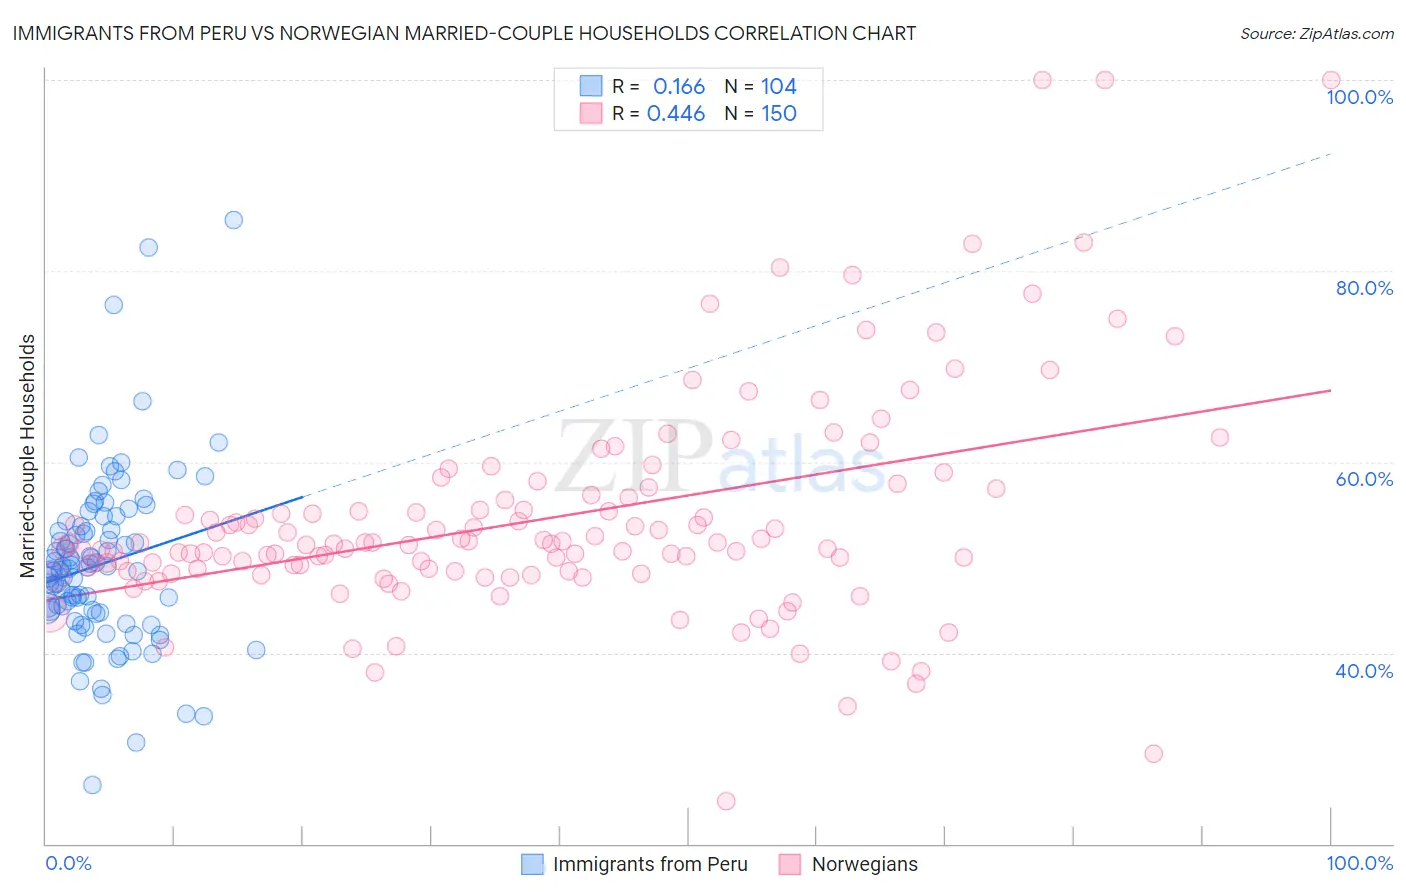
Immigrants from Peru vs Norwegian Married-couple Households Correlation Chart
The statistical analysis conducted on geographies consisting of 328,750,630 people shows a poor positive correlation between the proportion of Immigrants from Peru and percentage of married-couple family households in the United States with a correlation coefficient (R) of 0.166 and weighted average of 47.3%. Similarly, the statistical analysis conducted on geographies consisting of 532,882,581 people shows a moderate positive correlation between the proportion of Norwegians and percentage of married-couple family households in the United States with a correlation coefficient (R) of 0.446 and weighted average of 49.5%, a difference of 4.7%.
Married-couple Households Correlation Summary
| Measurement | Immigrants from Peru | Norwegian |
| Minimum | 26.2% | 24.5% |
| Maximum | 85.3% | 100.0% |
| Range | 59.1% | 75.5% |
| Mean | 49.2% | 54.0% |
| Median | 48.9% | 51.4% |
| Interquartile 25% (IQ1) | 44.3% | 48.6% |
| Interquartile 75% (IQ3) | 53.0% | 56.3% |
| Interquartile Range (IQR) | 8.7% | 7.7% |
| Standard Deviation (Sample) | 9.0% | 11.6% |
| Standard Deviation (Population) | 9.0% | 11.6% |
Similar Demographics by Married-couple Households
Demographics Similar to Immigrants from Peru by Married-couple Households
In terms of married-couple households, the demographic groups most similar to Immigrants from Peru are Immigrants from Iraq (47.3%, a difference of 0.010%), Immigrants from Hungary (47.3%, a difference of 0.010%), Celtic (47.3%, a difference of 0.020%), Immigrants from Denmark (47.3%, a difference of 0.030%), and Pakistani (47.3%, a difference of 0.070%).
| Demographics | Rating | Rank | Married-couple Households |
| Immigrants | Eastern Europe | 90.3 /100 | #121 | Exceptional 47.4% |
| Okinawans | 90.1 /100 | #122 | Exceptional 47.4% |
| Immigrants | Venezuela | 89.3 /100 | #123 | Excellent 47.4% |
| Zimbabweans | 89.2 /100 | #124 | Excellent 47.4% |
| Australians | 89.0 /100 | #125 | Excellent 47.4% |
| Pakistanis | 88.6 /100 | #126 | Excellent 47.3% |
| Celtics | 88.1 /100 | #127 | Excellent 47.3% |
| Immigrants | Peru | 87.9 /100 | #128 | Excellent 47.3% |
| Immigrants | Iraq | 87.8 /100 | #129 | Excellent 47.3% |
| Immigrants | Hungary | 87.8 /100 | #130 | Excellent 47.3% |
| Immigrants | Denmark | 87.5 /100 | #131 | Excellent 47.3% |
| Immigrants | Ukraine | 86.7 /100 | #132 | Excellent 47.3% |
| South Africans | 86.4 /100 | #133 | Excellent 47.3% |
| Immigrants | Greece | 86.0 /100 | #134 | Excellent 47.2% |
| Immigrants | Argentina | 86.0 /100 | #135 | Excellent 47.2% |
Demographics Similar to Norwegians by Married-couple Households
In terms of married-couple households, the demographic groups most similar to Norwegians are Scandinavian (49.6%, a difference of 0.050%), European (49.6%, a difference of 0.060%), Asian (49.5%, a difference of 0.11%), Dutch (49.5%, a difference of 0.12%), and Czech (49.4%, a difference of 0.20%).
| Demographics | Rating | Rank | Married-couple Households |
| Burmese | 100.0 /100 | #14 | Exceptional 49.8% |
| Koreans | 99.9 /100 | #15 | Exceptional 49.7% |
| Swedes | 99.9 /100 | #16 | Exceptional 49.7% |
| Immigrants | Hong Kong | 99.9 /100 | #17 | Exceptional 49.6% |
| English | 99.9 /100 | #18 | Exceptional 49.6% |
| Europeans | 99.9 /100 | #19 | Exceptional 49.6% |
| Scandinavians | 99.9 /100 | #20 | Exceptional 49.6% |
| Norwegians | 99.9 /100 | #21 | Exceptional 49.5% |
| Asians | 99.9 /100 | #22 | Exceptional 49.5% |
| Dutch | 99.9 /100 | #23 | Exceptional 49.5% |
| Czechs | 99.9 /100 | #24 | Exceptional 49.4% |
| Immigrants | Philippines | 99.9 /100 | #25 | Exceptional 49.3% |
| Immigrants | Scotland | 99.8 /100 | #26 | Exceptional 49.3% |
| Bhutanese | 99.8 /100 | #27 | Exceptional 49.3% |
| Germans | 99.8 /100 | #28 | Exceptional 49.2% |