Pennsylvania German vs Okinawan Single Father Households
COMPARE
Pennsylvania German
Okinawan
Single Father Households
Single Father Households Comparison
Pennsylvania Germans
Okinawans
2.4%
SINGLE FATHER HOUSEHOLDS
7.3/ 100
METRIC RATING
232nd/ 347
METRIC RANK
1.9%
SINGLE FATHER HOUSEHOLDS
100.0/ 100
METRIC RATING
10th/ 347
METRIC RANK
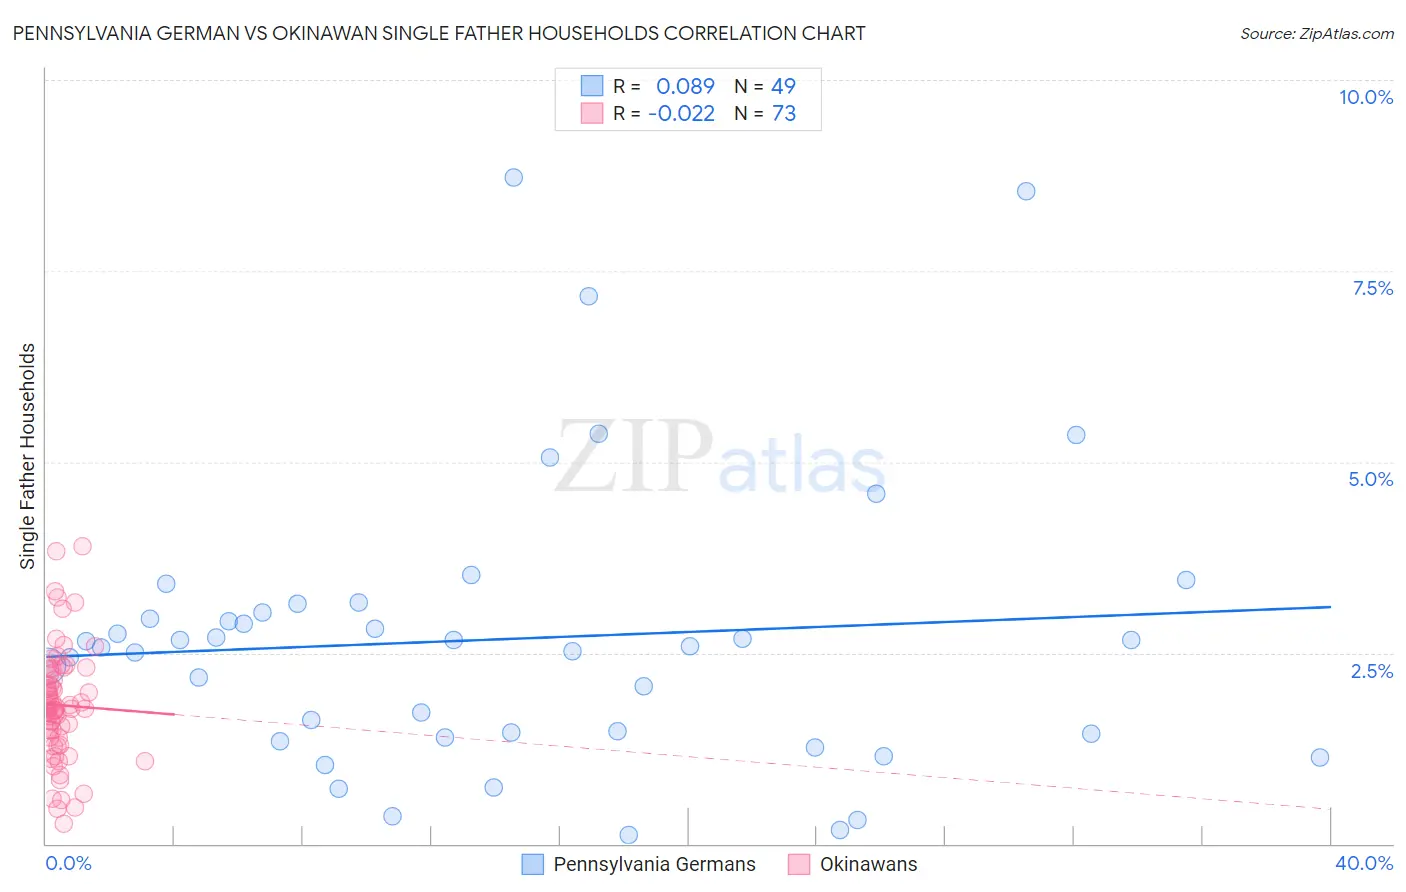
Pennsylvania German vs Okinawan Single Father Households Correlation Chart
The statistical analysis conducted on geographies consisting of 232,007,868 people shows a slight positive correlation between the proportion of Pennsylvania Germans and percentage of single father households in the United States with a correlation coefficient (R) of 0.089 and weighted average of 2.4%. Similarly, the statistical analysis conducted on geographies consisting of 73,621,147 people shows no correlation between the proportion of Okinawans and percentage of single father households in the United States with a correlation coefficient (R) of -0.022 and weighted average of 1.9%, a difference of 32.1%.
Single Father Households Correlation Summary
| Measurement | Pennsylvania German | Okinawan |
| Minimum | 0.11% | 0.27% |
| Maximum | 8.7% | 3.9% |
| Range | 8.6% | 3.6% |
| Mean | 2.7% | 1.8% |
| Median | 2.6% | 1.8% |
| Interquartile 25% (IQ1) | 1.4% | 1.4% |
| Interquartile 75% (IQ3) | 3.1% | 2.3% |
| Interquartile Range (IQR) | 1.7% | 0.87% |
| Standard Deviation (Sample) | 1.9% | 0.73% |
| Standard Deviation (Population) | 1.9% | 0.72% |
Similar Demographics by Single Father Households
Demographics Similar to Pennsylvania Germans by Single Father Households
In terms of single father households, the demographic groups most similar to Pennsylvania Germans are Immigrants from Western Africa (2.4%, a difference of 0.060%), Nonimmigrants (2.4%, a difference of 0.080%), Subsaharan African (2.4%, a difference of 0.25%), African (2.5%, a difference of 0.26%), and Immigrants (2.5%, a difference of 0.28%).
| Demographics | Rating | Rank | Single Father Households |
| Marshallese | 9.7 /100 | #225 | Tragic 2.4% |
| Blacks/African Americans | 9.7 /100 | #226 | Tragic 2.4% |
| Americans | 9.3 /100 | #227 | Tragic 2.4% |
| Immigrants | Ghana | 9.1 /100 | #228 | Tragic 2.4% |
| Immigrants | Zaire | 8.6 /100 | #229 | Tragic 2.4% |
| Sub-Saharan Africans | 8.3 /100 | #230 | Tragic 2.4% |
| Immigrants | Nonimmigrants | 7.6 /100 | #231 | Tragic 2.4% |
| Pennsylvania Germans | 7.3 /100 | #232 | Tragic 2.4% |
| Immigrants | Western Africa | 7.0 /100 | #233 | Tragic 2.4% |
| Africans | 6.3 /100 | #234 | Tragic 2.5% |
| Immigrants | Immigrants | 6.3 /100 | #235 | Tragic 2.5% |
| Cajuns | 6.1 /100 | #236 | Tragic 2.5% |
| Sierra Leoneans | 5.9 /100 | #237 | Tragic 2.5% |
| Immigrants | Sierra Leone | 5.8 /100 | #238 | Tragic 2.5% |
| Immigrants | Oceania | 5.8 /100 | #239 | Tragic 2.5% |
Demographics Similar to Okinawans by Single Father Households
In terms of single father households, the demographic groups most similar to Okinawans are Immigrants from Belarus (1.9%, a difference of 0.32%), Immigrants from China (1.8%, a difference of 0.36%), Immigrants from Ireland (1.8%, a difference of 0.50%), Cypriot (1.8%, a difference of 0.61%), and Immigrants from Taiwan (1.8%, a difference of 0.76%).
| Demographics | Rating | Rank | Single Father Households |
| Filipinos | 100.0 /100 | #3 | Exceptional 1.8% |
| Immigrants | Uzbekistan | 100.0 /100 | #4 | Exceptional 1.8% |
| Immigrants | Hong Kong | 100.0 /100 | #5 | Exceptional 1.8% |
| Immigrants | Taiwan | 100.0 /100 | #6 | Exceptional 1.8% |
| Cypriots | 100.0 /100 | #7 | Exceptional 1.8% |
| Immigrants | Ireland | 100.0 /100 | #8 | Exceptional 1.8% |
| Immigrants | China | 100.0 /100 | #9 | Exceptional 1.8% |
| Okinawans | 100.0 /100 | #10 | Exceptional 1.9% |
| Immigrants | Belarus | 100.0 /100 | #11 | Exceptional 1.9% |
| Immigrants | Greece | 100.0 /100 | #12 | Exceptional 1.9% |
| Immigrants | Singapore | 100.0 /100 | #13 | Exceptional 1.9% |
| Immigrants | Lithuania | 100.0 /100 | #14 | Exceptional 1.9% |
| Immigrants | Eastern Asia | 100.0 /100 | #15 | Exceptional 1.9% |
| Immigrants | Iran | 100.0 /100 | #16 | Exceptional 1.9% |
| Immigrants | India | 100.0 /100 | #17 | Exceptional 1.9% |