Pennsylvania German vs Liberian Single Father Households
COMPARE
Pennsylvania German
Liberian
Single Father Households
Single Father Households Comparison
Pennsylvania Germans
Liberians
2.4%
SINGLE FATHER HOUSEHOLDS
7.3/ 100
METRIC RATING
232nd/ 347
METRIC RANK
2.5%
SINGLE FATHER HOUSEHOLDS
2.0/ 100
METRIC RATING
251st/ 347
METRIC RANK
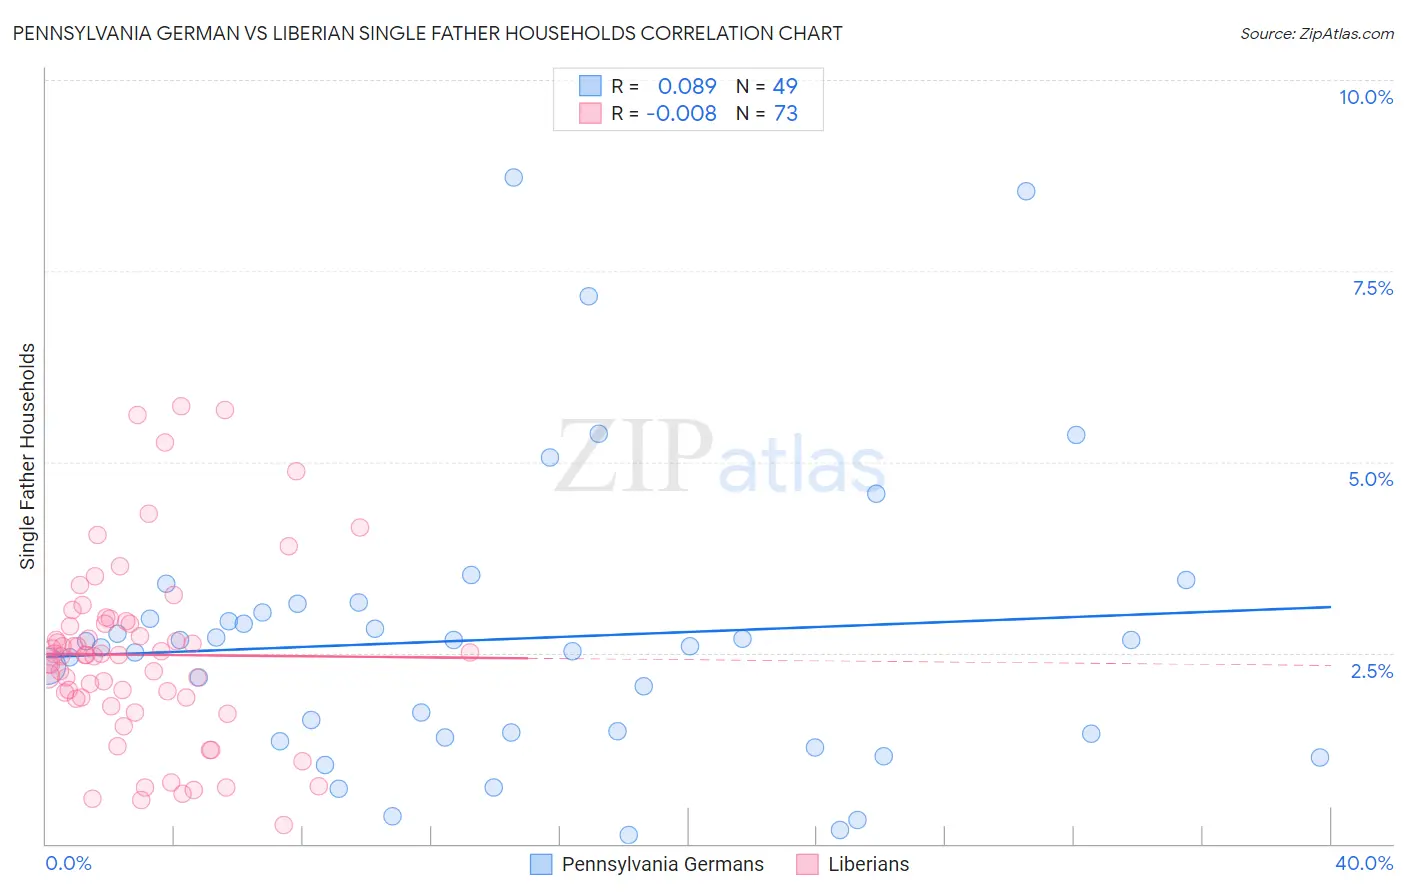
Pennsylvania German vs Liberian Single Father Households Correlation Chart
The statistical analysis conducted on geographies consisting of 232,007,868 people shows a slight positive correlation between the proportion of Pennsylvania Germans and percentage of single father households in the United States with a correlation coefficient (R) of 0.089 and weighted average of 2.4%. Similarly, the statistical analysis conducted on geographies consisting of 117,831,420 people shows no correlation between the proportion of Liberians and percentage of single father households in the United States with a correlation coefficient (R) of -0.008 and weighted average of 2.5%, a difference of 2.4%.
Single Father Households Correlation Summary
| Measurement | Pennsylvania German | Liberian |
| Minimum | 0.11% | 0.24% |
| Maximum | 8.7% | 5.7% |
| Range | 8.6% | 5.5% |
| Mean | 2.7% | 2.5% |
| Median | 2.6% | 2.5% |
| Interquartile 25% (IQ1) | 1.4% | 1.9% |
| Interquartile 75% (IQ3) | 3.1% | 2.9% |
| Interquartile Range (IQR) | 1.7% | 0.99% |
| Standard Deviation (Sample) | 1.9% | 1.2% |
| Standard Deviation (Population) | 1.9% | 1.2% |
Demographics Similar to Pennsylvania Germans and Liberians by Single Father Households
In terms of single father households, the demographic groups most similar to Pennsylvania Germans are Immigrants from Western Africa (2.4%, a difference of 0.060%), Nonimmigrants (2.4%, a difference of 0.080%), African (2.5%, a difference of 0.26%), Immigrants (2.5%, a difference of 0.28%), and Cajun (2.5%, a difference of 0.33%). Similarly, the demographic groups most similar to Liberians are Somali (2.5%, a difference of 0.090%), Immigrants from Cameroon (2.5%, a difference of 0.26%), Bahamian (2.5%, a difference of 0.34%), Delaware (2.5%, a difference of 0.39%), and Native Hawaiian (2.5%, a difference of 0.40%).
| Demographics | Rating | Rank | Single Father Households |
| Immigrants | Nonimmigrants | 7.6 /100 | #231 | Tragic 2.4% |
| Pennsylvania Germans | 7.3 /100 | #232 | Tragic 2.4% |
| Immigrants | Western Africa | 7.0 /100 | #233 | Tragic 2.4% |
| Africans | 6.3 /100 | #234 | Tragic 2.5% |
| Immigrants | Immigrants | 6.3 /100 | #235 | Tragic 2.5% |
| Cajuns | 6.1 /100 | #236 | Tragic 2.5% |
| Sierra Leoneans | 5.9 /100 | #237 | Tragic 2.5% |
| Immigrants | Sierra Leone | 5.8 /100 | #238 | Tragic 2.5% |
| Immigrants | Oceania | 5.8 /100 | #239 | Tragic 2.5% |
| Immigrants | Dominica | 4.8 /100 | #240 | Tragic 2.5% |
| Portuguese | 4.1 /100 | #241 | Tragic 2.5% |
| Osage | 4.1 /100 | #242 | Tragic 2.5% |
| Spaniards | 3.1 /100 | #243 | Tragic 2.5% |
| Immigrants | Middle Africa | 2.8 /100 | #244 | Tragic 2.5% |
| Basques | 2.5 /100 | #245 | Tragic 2.5% |
| Native Hawaiians | 2.5 /100 | #246 | Tragic 2.5% |
| Delaware | 2.5 /100 | #247 | Tragic 2.5% |
| Bahamians | 2.4 /100 | #248 | Tragic 2.5% |
| Immigrants | Cameroon | 2.3 /100 | #249 | Tragic 2.5% |
| Somalis | 2.1 /100 | #250 | Tragic 2.5% |
| Liberians | 2.0 /100 | #251 | Tragic 2.5% |