Mongolian vs Okinawan Single Father Households
COMPARE
Mongolian
Okinawan
Single Father Households
Single Father Households Comparison
Mongolians
Okinawans
2.1%
SINGLE FATHER HOUSEHOLDS
99.9/ 100
METRIC RATING
64th/ 347
METRIC RANK
1.9%
SINGLE FATHER HOUSEHOLDS
100.0/ 100
METRIC RATING
10th/ 347
METRIC RANK
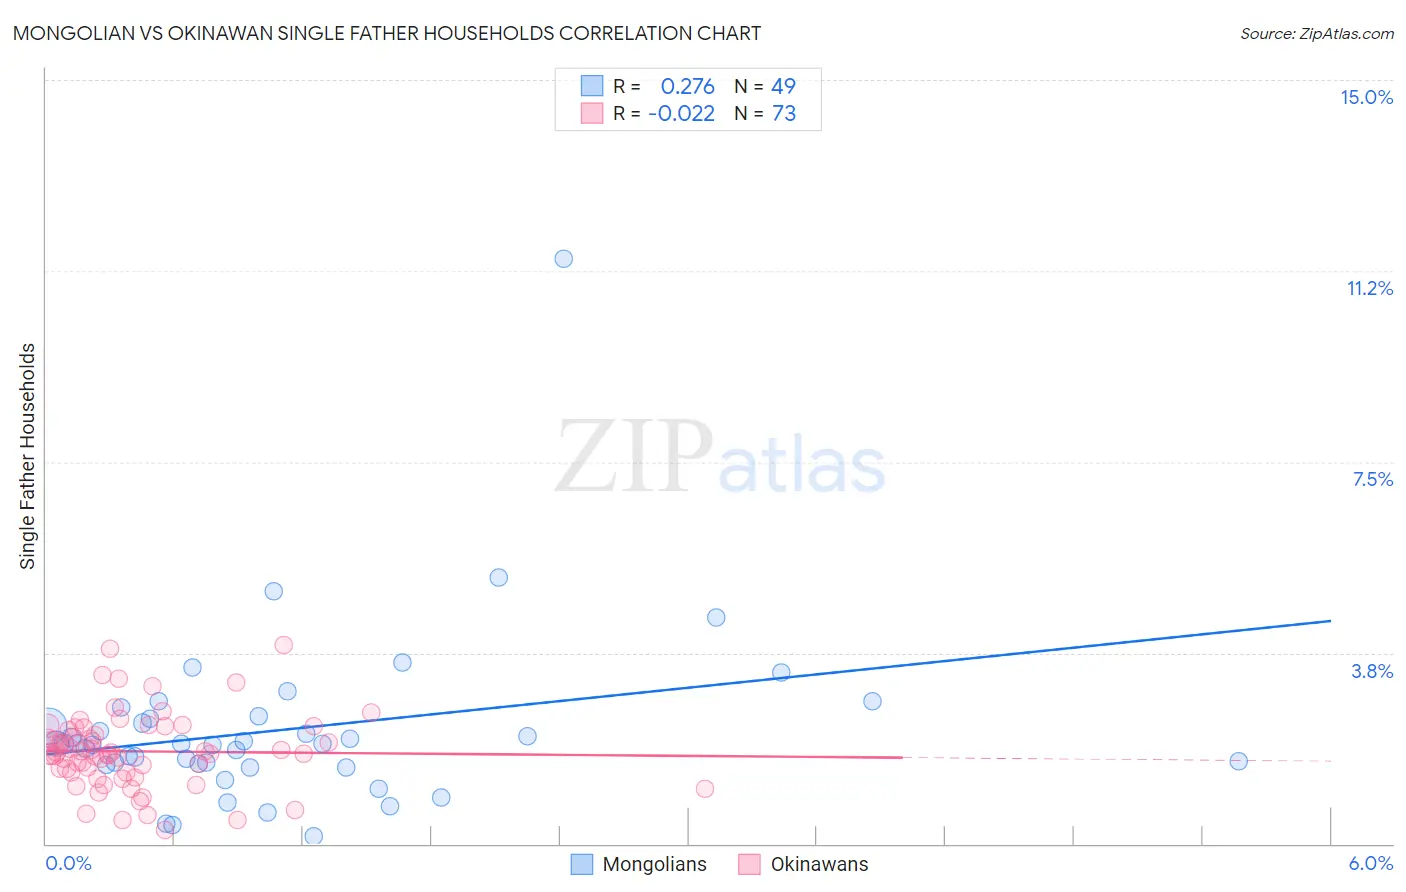
Mongolian vs Okinawan Single Father Households Correlation Chart
The statistical analysis conducted on geographies consisting of 139,899,645 people shows a weak positive correlation between the proportion of Mongolians and percentage of single father households in the United States with a correlation coefficient (R) of 0.276 and weighted average of 2.1%. Similarly, the statistical analysis conducted on geographies consisting of 73,621,147 people shows no correlation between the proportion of Okinawans and percentage of single father households in the United States with a correlation coefficient (R) of -0.022 and weighted average of 1.9%, a difference of 10.7%.
Single Father Households Correlation Summary
| Measurement | Mongolian | Okinawan |
| Minimum | 0.15% | 0.27% |
| Maximum | 11.5% | 3.9% |
| Range | 11.3% | 3.6% |
| Mean | 2.2% | 1.8% |
| Median | 2.0% | 1.8% |
| Interquartile 25% (IQ1) | 1.6% | 1.4% |
| Interquartile 75% (IQ3) | 2.5% | 2.3% |
| Interquartile Range (IQR) | 0.91% | 0.87% |
| Standard Deviation (Sample) | 1.7% | 0.73% |
| Standard Deviation (Population) | 1.7% | 0.72% |
Similar Demographics by Single Father Households
Demographics Similar to Mongolians by Single Father Households
In terms of single father households, the demographic groups most similar to Mongolians are Paraguayan (2.1%, a difference of 0.030%), Maltese (2.0%, a difference of 0.14%), Immigrants from Malaysia (2.0%, a difference of 0.34%), Immigrants from Western Asia (2.1%, a difference of 0.39%), and Immigrants from Italy (2.1%, a difference of 0.43%).
| Demographics | Rating | Rank | Single Father Households |
| Burmese | 99.9 /100 | #57 | Exceptional 2.0% |
| Immigrants | Czechoslovakia | 99.9 /100 | #58 | Exceptional 2.0% |
| Immigrants | North Macedonia | 99.9 /100 | #59 | Exceptional 2.0% |
| Immigrants | Austria | 99.9 /100 | #60 | Exceptional 2.0% |
| Vietnamese | 99.9 /100 | #61 | Exceptional 2.0% |
| Immigrants | Malaysia | 99.9 /100 | #62 | Exceptional 2.0% |
| Maltese | 99.9 /100 | #63 | Exceptional 2.0% |
| Mongolians | 99.9 /100 | #64 | Exceptional 2.1% |
| Paraguayans | 99.9 /100 | #65 | Exceptional 2.1% |
| Immigrants | Western Asia | 99.8 /100 | #66 | Exceptional 2.1% |
| Immigrants | Italy | 99.8 /100 | #67 | Exceptional 2.1% |
| Immigrants | Denmark | 99.8 /100 | #68 | Exceptional 2.1% |
| Immigrants | Romania | 99.8 /100 | #69 | Exceptional 2.1% |
| Egyptians | 99.8 /100 | #70 | Exceptional 2.1% |
| Immigrants | Kuwait | 99.8 /100 | #71 | Exceptional 2.1% |
Demographics Similar to Okinawans by Single Father Households
In terms of single father households, the demographic groups most similar to Okinawans are Immigrants from Belarus (1.9%, a difference of 0.32%), Immigrants from China (1.8%, a difference of 0.36%), Immigrants from Ireland (1.8%, a difference of 0.50%), Cypriot (1.8%, a difference of 0.61%), and Immigrants from Taiwan (1.8%, a difference of 0.76%).
| Demographics | Rating | Rank | Single Father Households |
| Filipinos | 100.0 /100 | #3 | Exceptional 1.8% |
| Immigrants | Uzbekistan | 100.0 /100 | #4 | Exceptional 1.8% |
| Immigrants | Hong Kong | 100.0 /100 | #5 | Exceptional 1.8% |
| Immigrants | Taiwan | 100.0 /100 | #6 | Exceptional 1.8% |
| Cypriots | 100.0 /100 | #7 | Exceptional 1.8% |
| Immigrants | Ireland | 100.0 /100 | #8 | Exceptional 1.8% |
| Immigrants | China | 100.0 /100 | #9 | Exceptional 1.8% |
| Okinawans | 100.0 /100 | #10 | Exceptional 1.9% |
| Immigrants | Belarus | 100.0 /100 | #11 | Exceptional 1.9% |
| Immigrants | Greece | 100.0 /100 | #12 | Exceptional 1.9% |
| Immigrants | Singapore | 100.0 /100 | #13 | Exceptional 1.9% |
| Immigrants | Lithuania | 100.0 /100 | #14 | Exceptional 1.9% |
| Immigrants | Eastern Asia | 100.0 /100 | #15 | Exceptional 1.9% |
| Immigrants | Iran | 100.0 /100 | #16 | Exceptional 1.9% |
| Immigrants | India | 100.0 /100 | #17 | Exceptional 1.9% |