Immigrants from Zimbabwe vs Okinawan Single Father Households
COMPARE
Immigrants from Zimbabwe
Okinawan
Single Father Households
Single Father Households Comparison
Immigrants from Zimbabwe
Okinawans
2.2%
SINGLE FATHER HOUSEHOLDS
90.2/ 100
METRIC RATING
145th/ 347
METRIC RANK
1.9%
SINGLE FATHER HOUSEHOLDS
100.0/ 100
METRIC RATING
10th/ 347
METRIC RANK
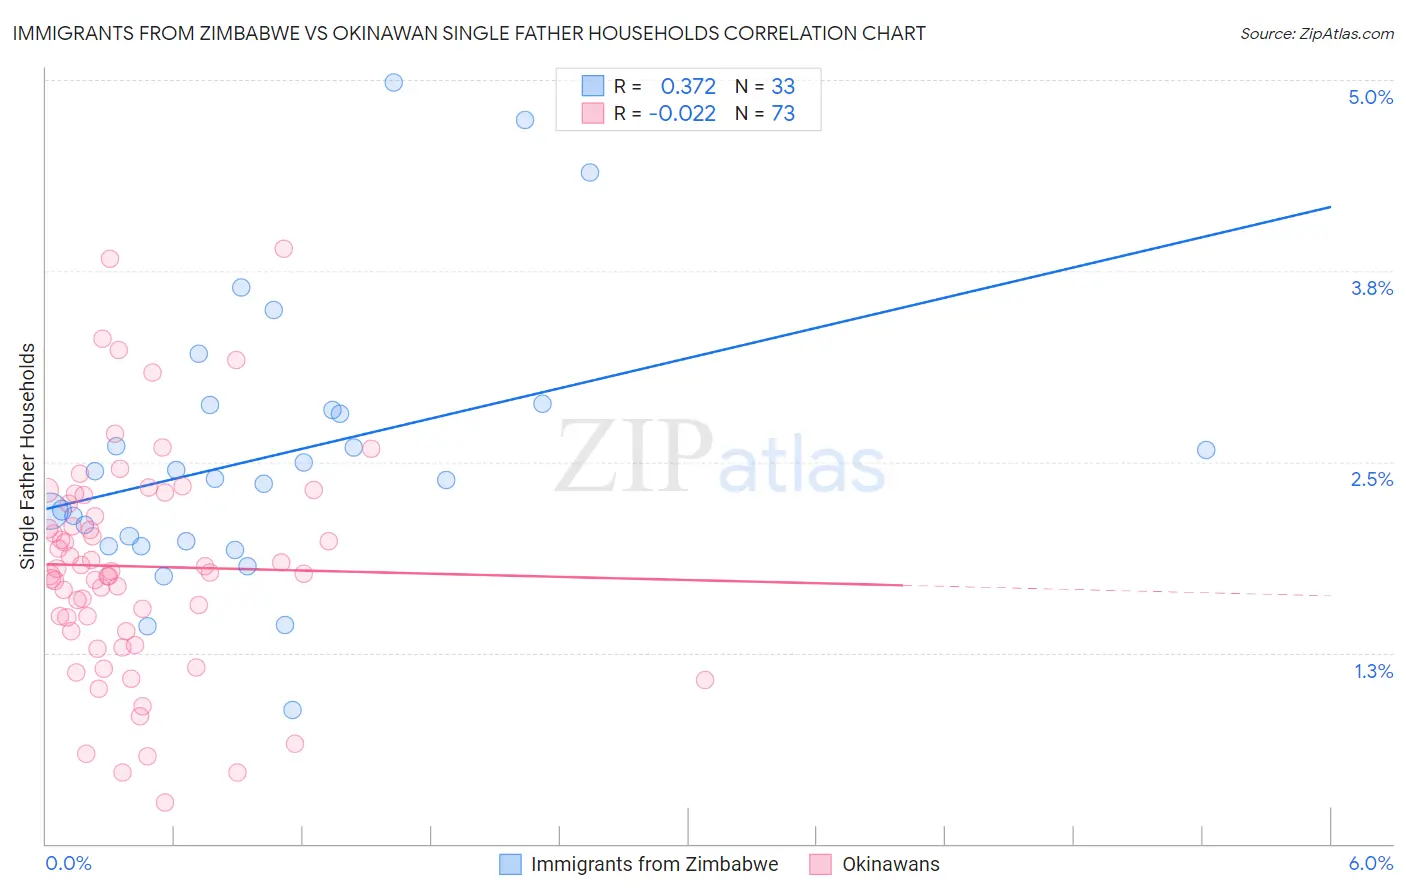
Immigrants from Zimbabwe vs Okinawan Single Father Households Correlation Chart
The statistical analysis conducted on geographies consisting of 117,591,458 people shows a mild positive correlation between the proportion of Immigrants from Zimbabwe and percentage of single father households in the United States with a correlation coefficient (R) of 0.372 and weighted average of 2.2%. Similarly, the statistical analysis conducted on geographies consisting of 73,621,147 people shows no correlation between the proportion of Okinawans and percentage of single father households in the United States with a correlation coefficient (R) of -0.022 and weighted average of 1.9%, a difference of 21.0%.
Single Father Households Correlation Summary
| Measurement | Immigrants from Zimbabwe | Okinawan |
| Minimum | 0.87% | 0.27% |
| Maximum | 5.0% | 3.9% |
| Range | 4.1% | 3.6% |
| Mean | 2.5% | 1.8% |
| Median | 2.4% | 1.8% |
| Interquartile 25% (IQ1) | 2.0% | 1.4% |
| Interquartile 75% (IQ3) | 2.9% | 2.3% |
| Interquartile Range (IQR) | 0.89% | 0.87% |
| Standard Deviation (Sample) | 0.90% | 0.73% |
| Standard Deviation (Population) | 0.89% | 0.72% |
Similar Demographics by Single Father Households
Demographics Similar to Immigrants from Zimbabwe by Single Father Households
In terms of single father households, the demographic groups most similar to Immigrants from Zimbabwe are Northern European (2.2%, a difference of 0.080%), Slovak (2.2%, a difference of 0.11%), Slavic (2.2%, a difference of 0.26%), South American Indian (2.3%, a difference of 0.35%), and Senegalese (2.3%, a difference of 0.36%).
| Demographics | Rating | Rank | Single Father Households |
| West Indians | 94.1 /100 | #138 | Exceptional 2.2% |
| Brazilians | 92.8 /100 | #139 | Exceptional 2.2% |
| British | 92.8 /100 | #140 | Exceptional 2.2% |
| Laotians | 92.5 /100 | #141 | Exceptional 2.2% |
| Luxembourgers | 92.3 /100 | #142 | Exceptional 2.2% |
| Immigrants | Nepal | 92.1 /100 | #143 | Exceptional 2.2% |
| Slovaks | 90.7 /100 | #144 | Exceptional 2.2% |
| Immigrants | Zimbabwe | 90.2 /100 | #145 | Exceptional 2.2% |
| Northern Europeans | 89.8 /100 | #146 | Excellent 2.2% |
| Slavs | 88.9 /100 | #147 | Excellent 2.2% |
| South American Indians | 88.5 /100 | #148 | Excellent 2.3% |
| Senegalese | 88.4 /100 | #149 | Excellent 2.3% |
| Venezuelans | 86.2 /100 | #150 | Excellent 2.3% |
| Immigrants | Syria | 84.8 /100 | #151 | Excellent 2.3% |
| Immigrants | Venezuela | 83.2 /100 | #152 | Excellent 2.3% |
Demographics Similar to Okinawans by Single Father Households
In terms of single father households, the demographic groups most similar to Okinawans are Immigrants from Belarus (1.9%, a difference of 0.32%), Immigrants from China (1.8%, a difference of 0.36%), Immigrants from Ireland (1.8%, a difference of 0.50%), Cypriot (1.8%, a difference of 0.61%), and Immigrants from Taiwan (1.8%, a difference of 0.76%).
| Demographics | Rating | Rank | Single Father Households |
| Filipinos | 100.0 /100 | #3 | Exceptional 1.8% |
| Immigrants | Uzbekistan | 100.0 /100 | #4 | Exceptional 1.8% |
| Immigrants | Hong Kong | 100.0 /100 | #5 | Exceptional 1.8% |
| Immigrants | Taiwan | 100.0 /100 | #6 | Exceptional 1.8% |
| Cypriots | 100.0 /100 | #7 | Exceptional 1.8% |
| Immigrants | Ireland | 100.0 /100 | #8 | Exceptional 1.8% |
| Immigrants | China | 100.0 /100 | #9 | Exceptional 1.8% |
| Okinawans | 100.0 /100 | #10 | Exceptional 1.9% |
| Immigrants | Belarus | 100.0 /100 | #11 | Exceptional 1.9% |
| Immigrants | Greece | 100.0 /100 | #12 | Exceptional 1.9% |
| Immigrants | Singapore | 100.0 /100 | #13 | Exceptional 1.9% |
| Immigrants | Lithuania | 100.0 /100 | #14 | Exceptional 1.9% |
| Immigrants | Eastern Asia | 100.0 /100 | #15 | Exceptional 1.9% |
| Immigrants | Iran | 100.0 /100 | #16 | Exceptional 1.9% |
| Immigrants | India | 100.0 /100 | #17 | Exceptional 1.9% |