Immigrants from Belarus vs Immigrants from Poland Family Households with Children
COMPARE
Immigrants from Belarus
Immigrants from Poland
Family Households with Children
Family Households with Children Comparison
Immigrants from Belarus
Immigrants from Poland
26.8%
FAMILY HOUSEHOLDS WITH CHILDREN
1.1/ 100
METRIC RATING
261st/ 347
METRIC RANK
27.2%
FAMILY HOUSEHOLDS WITH CHILDREN
16.4/ 100
METRIC RATING
208th/ 347
METRIC RANK
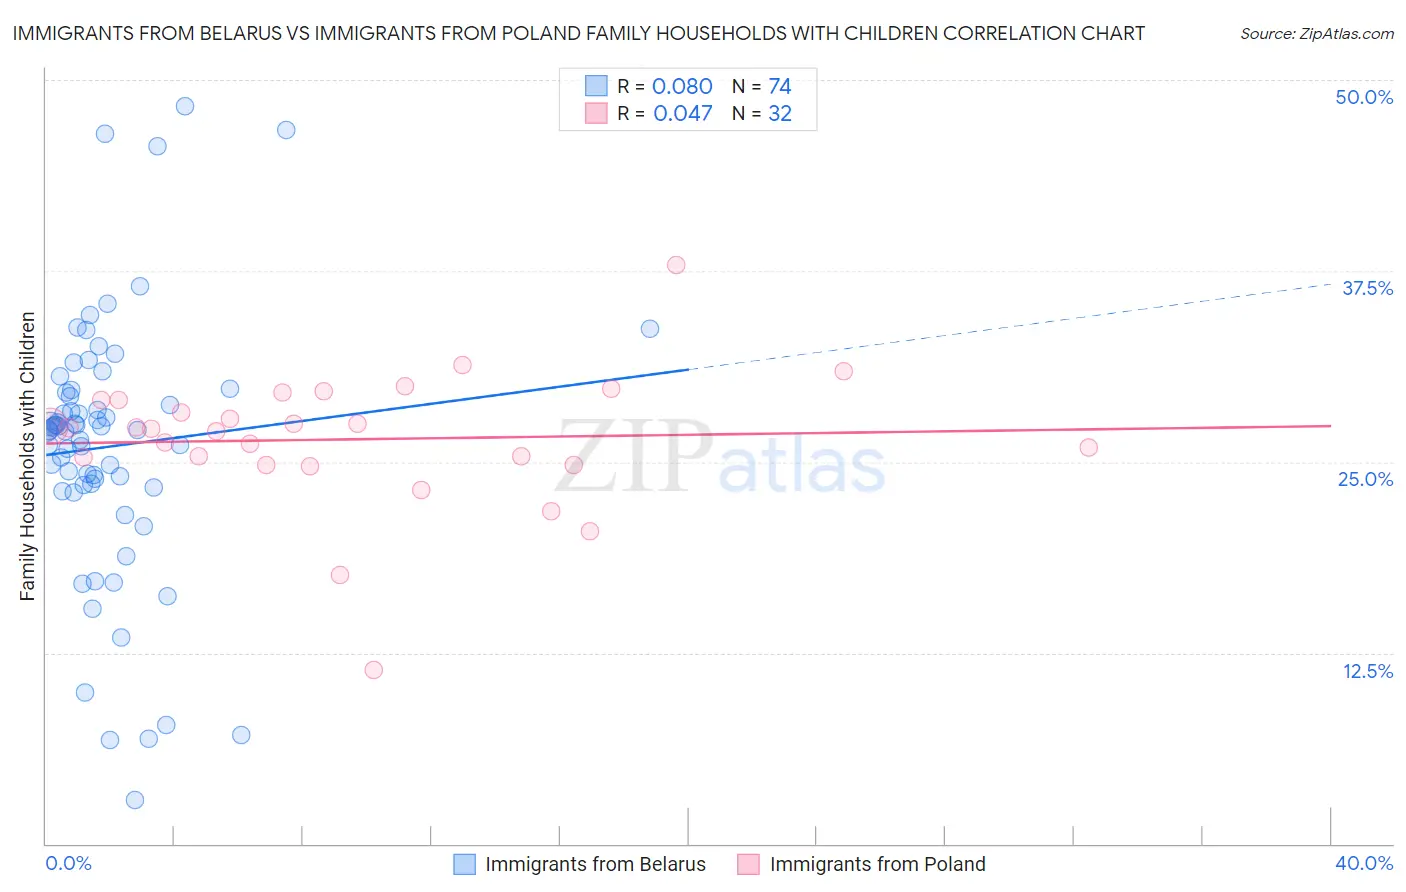
Immigrants from Belarus vs Immigrants from Poland Family Households with Children Correlation Chart
The statistical analysis conducted on geographies consisting of 150,186,430 people shows a slight positive correlation between the proportion of Immigrants from Belarus and percentage of family households with children in the United States with a correlation coefficient (R) of 0.080 and weighted average of 26.8%. Similarly, the statistical analysis conducted on geographies consisting of 304,692,657 people shows no correlation between the proportion of Immigrants from Poland and percentage of family households with children in the United States with a correlation coefficient (R) of 0.047 and weighted average of 27.2%, a difference of 1.6%.
Family Households with Children Correlation Summary
| Measurement | Immigrants from Belarus | Immigrants from Poland |
| Minimum | 2.8% | 11.4% |
| Maximum | 48.3% | 37.9% |
| Range | 45.4% | 26.5% |
| Mean | 26.0% | 26.5% |
| Median | 27.2% | 27.2% |
| Interquartile 25% (IQ1) | 23.5% | 25.0% |
| Interquartile 75% (IQ3) | 29.5% | 29.0% |
| Interquartile Range (IQR) | 6.0% | 4.0% |
| Standard Deviation (Sample) | 8.6% | 4.5% |
| Standard Deviation (Population) | 8.6% | 4.4% |
Similar Demographics by Family Households with Children
Demographics Similar to Immigrants from Belarus by Family Households with Children
In terms of family households with children, the demographic groups most similar to Immigrants from Belarus are Immigrants from Jamaica (26.8%, a difference of 0.060%), Immigrants from Russia (26.8%, a difference of 0.060%), Immigrants from North Macedonia (26.7%, a difference of 0.060%), Immigrants from Lithuania (26.8%, a difference of 0.070%), and Taiwanese (26.7%, a difference of 0.090%).
| Demographics | Rating | Rank | Family Households with Children |
| Immigrants | Scotland | 1.5 /100 | #254 | Tragic 26.8% |
| German Russians | 1.5 /100 | #255 | Tragic 26.8% |
| Scotch-Irish | 1.4 /100 | #256 | Tragic 26.8% |
| Slavs | 1.3 /100 | #257 | Tragic 26.8% |
| Immigrants | Cuba | 1.3 /100 | #258 | Tragic 26.8% |
| Immigrants | Lithuania | 1.2 /100 | #259 | Tragic 26.8% |
| Immigrants | Jamaica | 1.2 /100 | #260 | Tragic 26.8% |
| Immigrants | Belarus | 1.1 /100 | #261 | Tragic 26.8% |
| Immigrants | Russia | 1.0 /100 | #262 | Tragic 26.8% |
| Immigrants | North Macedonia | 1.0 /100 | #263 | Tragic 26.7% |
| Taiwanese | 0.9 /100 | #264 | Tragic 26.7% |
| Chippewa | 0.9 /100 | #265 | Tragic 26.7% |
| Maltese | 0.9 /100 | #266 | Tragic 26.7% |
| Immigrants | Uzbekistan | 0.9 /100 | #267 | Tragic 26.7% |
| Immigrants | Belgium | 0.9 /100 | #268 | Tragic 26.7% |
Demographics Similar to Immigrants from Poland by Family Households with Children
In terms of family households with children, the demographic groups most similar to Immigrants from Poland are Dutch West Indian (27.2%, a difference of 0.030%), Immigrants from Ukraine (27.2%, a difference of 0.090%), Welsh (27.2%, a difference of 0.10%), Immigrants from Dominica (27.2%, a difference of 0.11%), and Okinawan (27.2%, a difference of 0.12%).
| Demographics | Rating | Rank | Family Households with Children |
| Bhutanese | 25.1 /100 | #201 | Fair 27.3% |
| Americans | 22.8 /100 | #202 | Fair 27.3% |
| Kiowa | 22.2 /100 | #203 | Fair 27.3% |
| Immigrants | Sudan | 21.6 /100 | #204 | Fair 27.3% |
| Immigrants | Haiti | 20.3 /100 | #205 | Fair 27.2% |
| Immigrants | Micronesia | 20.2 /100 | #206 | Fair 27.2% |
| Haitians | 19.8 /100 | #207 | Poor 27.2% |
| Immigrants | Poland | 16.4 /100 | #208 | Poor 27.2% |
| Dutch West Indians | 15.8 /100 | #209 | Poor 27.2% |
| Immigrants | Ukraine | 14.4 /100 | #210 | Poor 27.2% |
| Welsh | 14.2 /100 | #211 | Poor 27.2% |
| Immigrants | Dominica | 13.9 /100 | #212 | Poor 27.2% |
| Okinawans | 13.7 /100 | #213 | Poor 27.2% |
| Africans | 13.0 /100 | #214 | Poor 27.2% |
| Northern Europeans | 12.8 /100 | #215 | Poor 27.2% |