Yuman vs Israeli Average Family Size
COMPARE
Yuman
Israeli
Average Family Size
Average Family Size Comparison
Yuman
Israelis
3.47
AVERAGE FAMILY SIZE
100.0/ 100
METRIC RATING
21st/ 347
METRIC RANK
3.23
AVERAGE FAMILY SIZE
48.7/ 100
METRIC RATING
176th/ 347
METRIC RANK
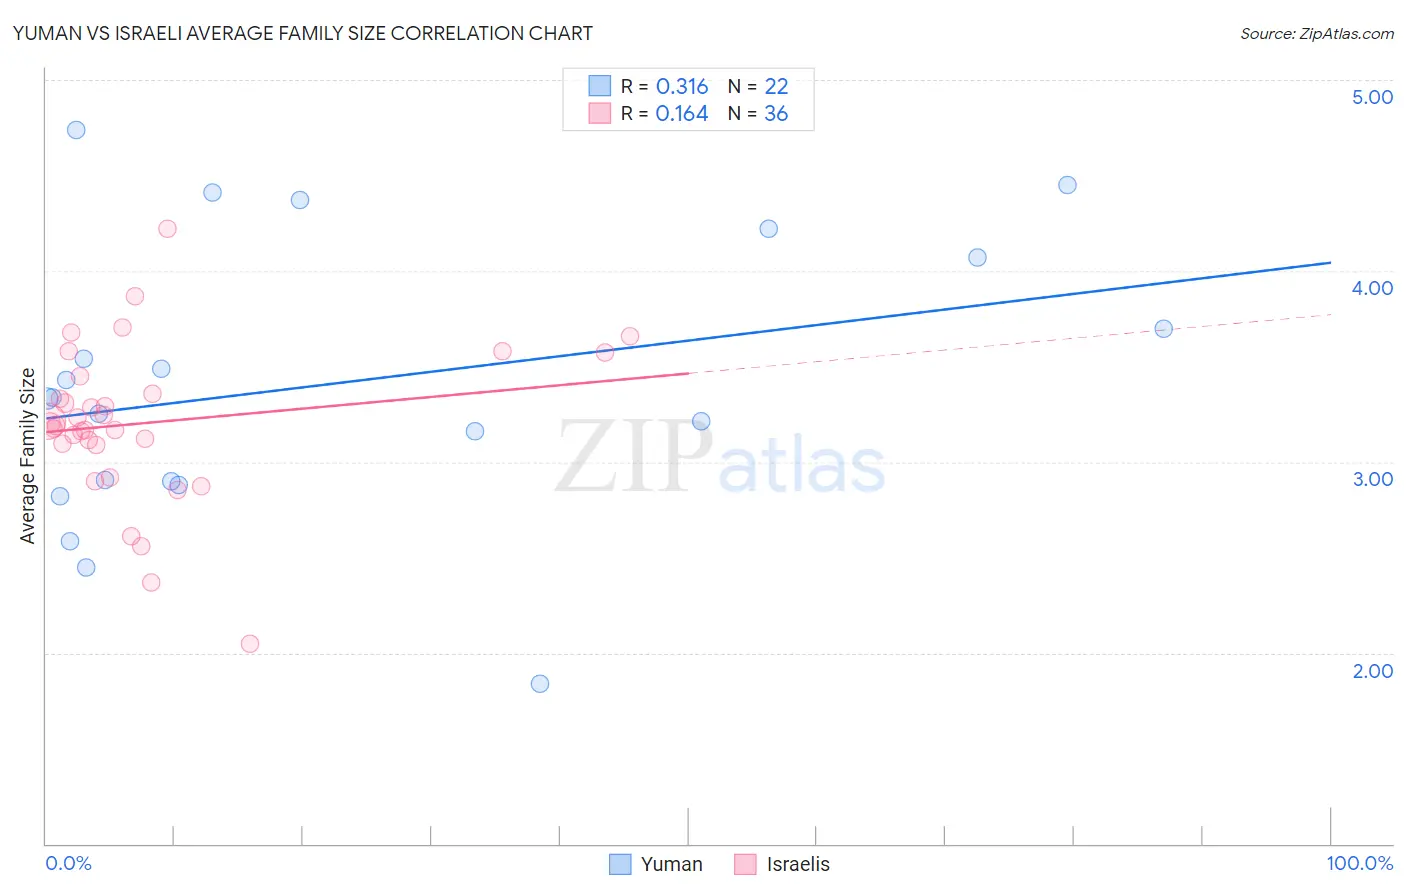
Yuman vs Israeli Average Family Size Correlation Chart
The statistical analysis conducted on geographies consisting of 40,663,604 people shows a mild positive correlation between the proportion of Yuman and average family size in the United States with a correlation coefficient (R) of 0.316 and weighted average of 3.47. Similarly, the statistical analysis conducted on geographies consisting of 211,000,006 people shows a poor positive correlation between the proportion of Israelis and average family size in the United States with a correlation coefficient (R) of 0.164 and weighted average of 3.23, a difference of 7.4%.
Average Family Size Correlation Summary
| Measurement | Yuman | Israeli |
| Minimum | 1.84 | 2.05 |
| Maximum | 4.74 | 4.22 |
| Range | 2.90 | 2.17 |
| Mean | 3.41 | 3.20 |
| Median | 3.33 | 3.20 |
| Interquartile 25% (IQ1) | 2.90 | 3.09 |
| Interquartile 75% (IQ3) | 4.07 | 3.40 |
| Interquartile Range (IQR) | 1.17 | 0.31 |
| Standard Deviation (Sample) | 0.73 | 0.41 |
| Standard Deviation (Population) | 0.72 | 0.41 |
Similar Demographics by Average Family Size
Demographics Similar to Yuman by Average Family Size
In terms of average family size, the demographic groups most similar to Yuman are Apache (3.46, a difference of 0.060%), Cheyenne (3.47, a difference of 0.25%), Mexican (3.48, a difference of 0.30%), Immigrants from Fiji (3.45, a difference of 0.35%), and Salvadoran (3.48, a difference of 0.36%).
| Demographics | Rating | Rank | Average Family Size |
| Immigrants | Central America | 100.0 /100 | #14 | Exceptional 3.49 |
| Tongans | 100.0 /100 | #15 | Exceptional 3.49 |
| Ute | 100.0 /100 | #16 | Exceptional 3.49 |
| Immigrants | El Salvador | 100.0 /100 | #17 | Exceptional 3.49 |
| Salvadorans | 100.0 /100 | #18 | Exceptional 3.48 |
| Mexicans | 100.0 /100 | #19 | Exceptional 3.48 |
| Cheyenne | 100.0 /100 | #20 | Exceptional 3.47 |
| Yuman | 100.0 /100 | #21 | Exceptional 3.47 |
| Apache | 100.0 /100 | #22 | Exceptional 3.46 |
| Immigrants | Fiji | 100.0 /100 | #23 | Exceptional 3.45 |
| Natives/Alaskans | 100.0 /100 | #24 | Exceptional 3.45 |
| Yakama | 100.0 /100 | #25 | Exceptional 3.45 |
| Native Hawaiians | 100.0 /100 | #26 | Exceptional 3.43 |
| Mexican American Indians | 100.0 /100 | #27 | Exceptional 3.43 |
| Immigrants | Latin America | 100.0 /100 | #28 | Exceptional 3.42 |
Demographics Similar to Israelis by Average Family Size
In terms of average family size, the demographic groups most similar to Israelis are Immigrants from South Central Asia (3.23, a difference of 0.020%), Immigrants from China (3.23, a difference of 0.020%), Argentinean (3.23, a difference of 0.020%), Spaniard (3.23, a difference of 0.030%), and Immigrants from Korea (3.23, a difference of 0.030%).
| Demographics | Rating | Rank | Average Family Size |
| Aleuts | 54.1 /100 | #169 | Average 3.23 |
| Arabs | 53.8 /100 | #170 | Average 3.23 |
| Chileans | 53.2 /100 | #171 | Average 3.23 |
| Immigrants | Congo | 52.7 /100 | #172 | Average 3.23 |
| Immigrants | Uruguay | 52.0 /100 | #173 | Average 3.23 |
| Immigrants | South Central Asia | 50.0 /100 | #174 | Average 3.23 |
| Immigrants | China | 49.9 /100 | #175 | Average 3.23 |
| Israelis | 48.7 /100 | #176 | Average 3.23 |
| Argentineans | 47.4 /100 | #177 | Average 3.23 |
| Spaniards | 47.2 /100 | #178 | Average 3.23 |
| Immigrants | Korea | 46.9 /100 | #179 | Average 3.23 |
| Palestinians | 46.6 /100 | #180 | Average 3.23 |
| Spanish | 44.8 /100 | #181 | Average 3.23 |
| Moroccans | 44.2 /100 | #182 | Average 3.22 |
| Immigrants | Northern Africa | 41.7 /100 | #183 | Average 3.22 |