Palestinian vs Immigrants from Northern Africa Family Households
COMPARE
Palestinian
Immigrants from Northern Africa
Family Households
Family Households Comparison
Palestinians
Immigrants from Northern Africa
65.1%
FAMILY HOUSEHOLDS
97.2/ 100
METRIC RATING
108th/ 347
METRIC RANK
63.5%
FAMILY HOUSEHOLDS
2.6/ 100
METRIC RATING
232nd/ 347
METRIC RANK
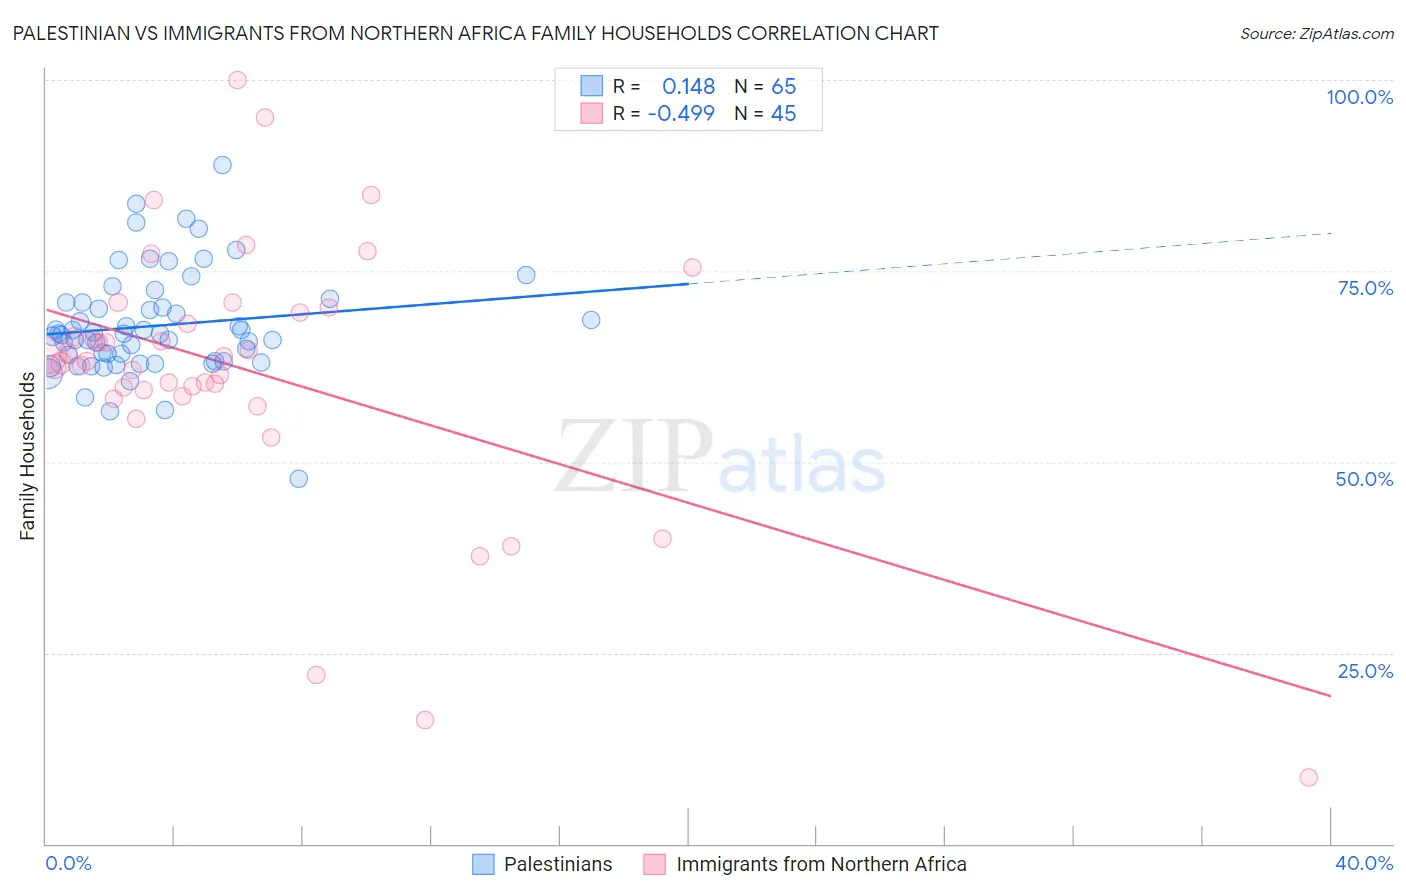
Palestinian vs Immigrants from Northern Africa Family Households Correlation Chart
The statistical analysis conducted on geographies consisting of 216,401,165 people shows a poor positive correlation between the proportion of Palestinians and percentage of family households in the United States with a correlation coefficient (R) of 0.148 and weighted average of 65.1%. Similarly, the statistical analysis conducted on geographies consisting of 321,089,077 people shows a moderate negative correlation between the proportion of Immigrants from Northern Africa and percentage of family households in the United States with a correlation coefficient (R) of -0.499 and weighted average of 63.5%, a difference of 2.4%.
Family Households Correlation Summary
| Measurement | Palestinian | Immigrants from Northern Africa |
| Minimum | 47.7% | 8.7% |
| Maximum | 88.8% | 100.0% |
| Range | 41.1% | 91.3% |
| Mean | 67.8% | 62.0% |
| Median | 66.8% | 63.2% |
| Interquartile 25% (IQ1) | 63.2% | 59.0% |
| Interquartile 75% (IQ3) | 70.8% | 69.9% |
| Interquartile Range (IQR) | 7.7% | 10.8% |
| Standard Deviation (Sample) | 6.9% | 17.3% |
| Standard Deviation (Population) | 6.8% | 17.2% |
Similar Demographics by Family Households
Demographics Similar to Palestinians by Family Households
In terms of family households, the demographic groups most similar to Palestinians are White/Caucasian (65.1%, a difference of 0.010%), Alaska Native (65.1%, a difference of 0.010%), English (65.1%, a difference of 0.020%), Immigrants from Guatemala (65.0%, a difference of 0.040%), and Scandinavian (65.0%, a difference of 0.050%).
| Demographics | Rating | Rank | Family Households |
| Chileans | 98.1 /100 | #101 | Exceptional 65.2% |
| Immigrants | Sri Lanka | 98.0 /100 | #102 | Exceptional 65.1% |
| Indians (Asian) | 97.9 /100 | #103 | Exceptional 65.1% |
| Spaniards | 97.8 /100 | #104 | Exceptional 65.1% |
| English | 97.4 /100 | #105 | Exceptional 65.1% |
| Whites/Caucasians | 97.3 /100 | #106 | Exceptional 65.1% |
| Alaska Natives | 97.3 /100 | #107 | Exceptional 65.1% |
| Palestinians | 97.2 /100 | #108 | Exceptional 65.1% |
| Immigrants | Guatemala | 96.9 /100 | #109 | Exceptional 65.0% |
| Scandinavians | 96.8 /100 | #110 | Exceptional 65.0% |
| Europeans | 96.8 /100 | #111 | Exceptional 65.0% |
| Immigrants | Jordan | 96.5 /100 | #112 | Exceptional 65.0% |
| Spanish | 96.2 /100 | #113 | Exceptional 65.0% |
| Argentineans | 95.7 /100 | #114 | Exceptional 65.0% |
| Ecuadorians | 95.4 /100 | #115 | Exceptional 65.0% |
Demographics Similar to Immigrants from Northern Africa by Family Households
In terms of family households, the demographic groups most similar to Immigrants from Northern Africa are Immigrants from Armenia (63.5%, a difference of 0.010%), Immigrants from Greece (63.5%, a difference of 0.030%), Finnish (63.5%, a difference of 0.040%), Immigrants from Brazil (63.6%, a difference of 0.050%), and Albanian (63.5%, a difference of 0.070%).
| Demographics | Rating | Rank | Family Households |
| Immigrants | Hungary | 4.3 /100 | #225 | Tragic 63.6% |
| Immigrants | Bahamas | 4.2 /100 | #226 | Tragic 63.6% |
| Trinidadians and Tobagonians | 4.1 /100 | #227 | Tragic 63.6% |
| Blackfeet | 3.6 /100 | #228 | Tragic 63.6% |
| Bulgarians | 3.4 /100 | #229 | Tragic 63.6% |
| Immigrants | Brazil | 3.0 /100 | #230 | Tragic 63.6% |
| Immigrants | Greece | 2.9 /100 | #231 | Tragic 63.5% |
| Immigrants | Northern Africa | 2.6 /100 | #232 | Tragic 63.5% |
| Immigrants | Armenia | 2.6 /100 | #233 | Tragic 63.5% |
| Finns | 2.3 /100 | #234 | Tragic 63.5% |
| Albanians | 2.2 /100 | #235 | Tragic 63.5% |
| Ghanaians | 2.1 /100 | #236 | Tragic 63.5% |
| Comanche | 2.1 /100 | #237 | Tragic 63.5% |
| Immigrants | Zimbabwe | 2.0 /100 | #238 | Tragic 63.5% |
| Aleuts | 1.9 /100 | #239 | Tragic 63.4% |