Hopi vs Immigrants from Northern Africa Family Households
COMPARE
Hopi
Immigrants from Northern Africa
Family Households
Family Households Comparison
Hopi
Immigrants from Northern Africa
65.3%
FAMILY HOUSEHOLDS
98.8/ 100
METRIC RATING
92nd/ 347
METRIC RANK
63.5%
FAMILY HOUSEHOLDS
2.6/ 100
METRIC RATING
232nd/ 347
METRIC RANK
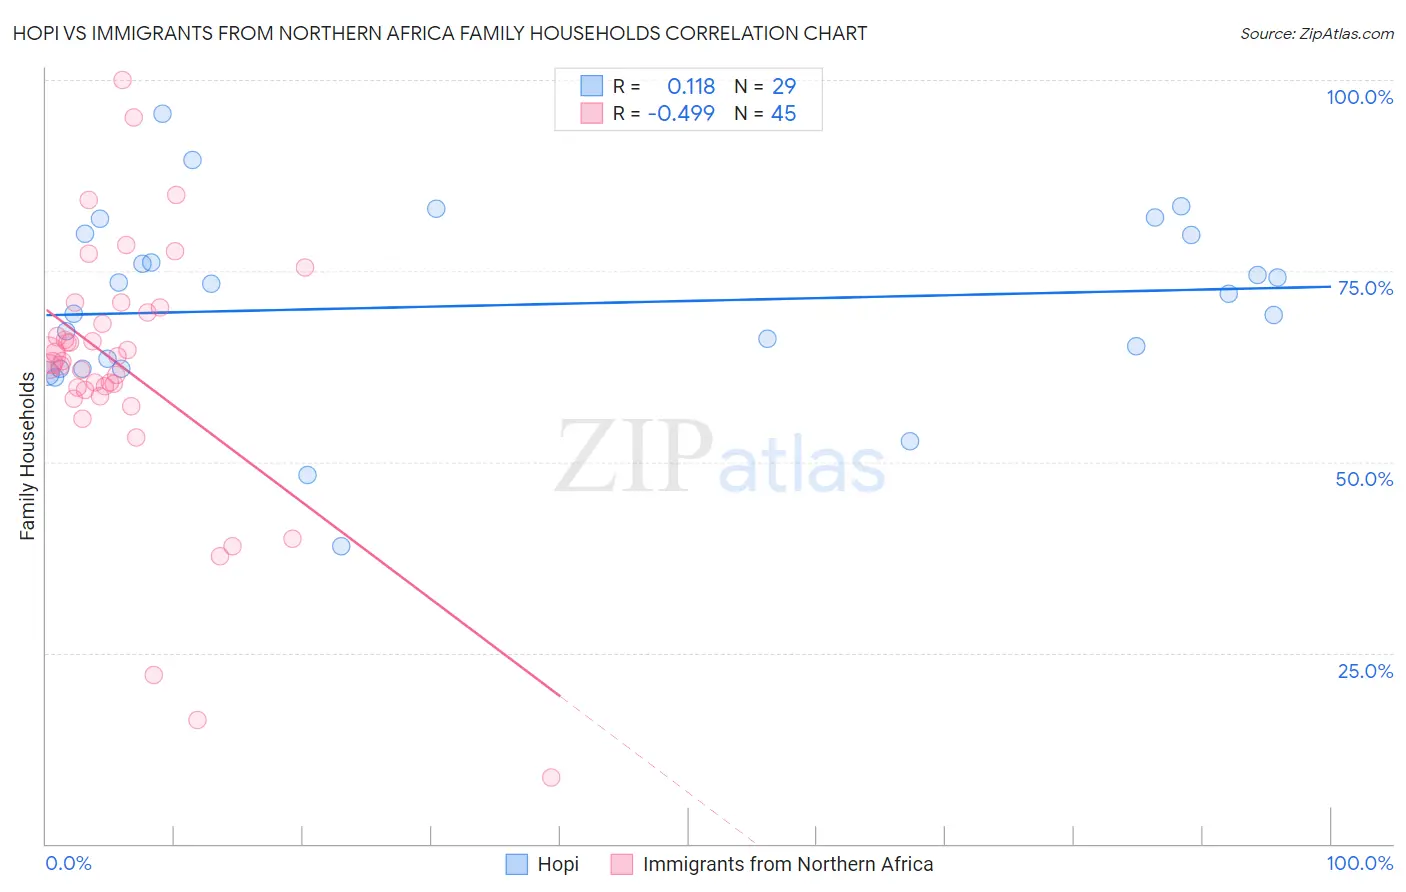
Hopi vs Immigrants from Northern Africa Family Households Correlation Chart
The statistical analysis conducted on geographies consisting of 74,733,485 people shows a poor positive correlation between the proportion of Hopi and percentage of family households in the United States with a correlation coefficient (R) of 0.118 and weighted average of 65.3%. Similarly, the statistical analysis conducted on geographies consisting of 321,089,077 people shows a moderate negative correlation between the proportion of Immigrants from Northern Africa and percentage of family households in the United States with a correlation coefficient (R) of -0.499 and weighted average of 63.5%, a difference of 2.7%.
Family Households Correlation Summary
| Measurement | Hopi | Immigrants from Northern Africa |
| Minimum | 38.9% | 8.7% |
| Maximum | 95.7% | 100.0% |
| Range | 56.8% | 91.3% |
| Mean | 70.5% | 62.0% |
| Median | 72.0% | 63.2% |
| Interquartile 25% (IQ1) | 62.1% | 59.0% |
| Interquartile 75% (IQ3) | 79.8% | 69.9% |
| Interquartile Range (IQR) | 17.7% | 10.8% |
| Standard Deviation (Sample) | 12.2% | 17.3% |
| Standard Deviation (Population) | 12.0% | 17.2% |
Similar Demographics by Family Households
Demographics Similar to Hopi by Family Households
In terms of family households, the demographic groups most similar to Hopi are Guyanese (65.3%, a difference of 0.0%), Immigrants from Poland (65.2%, a difference of 0.020%), Crow (65.3%, a difference of 0.040%), Immigrants from Portugal (65.2%, a difference of 0.050%), and Swiss (65.2%, a difference of 0.050%).
| Demographics | Rating | Rank | Family Households |
| Immigrants | Cambodia | 99.5 /100 | #85 | Exceptional 65.4% |
| Egyptians | 99.4 /100 | #86 | Exceptional 65.4% |
| Immigrants | Egypt | 99.2 /100 | #87 | Exceptional 65.3% |
| Immigrants | Haiti | 99.1 /100 | #88 | Exceptional 65.3% |
| Immigrants | Caribbean | 99.1 /100 | #89 | Exceptional 65.3% |
| Immigrants | Laos | 99.1 /100 | #90 | Exceptional 65.3% |
| Crow | 98.9 /100 | #91 | Exceptional 65.3% |
| Hopi | 98.8 /100 | #92 | Exceptional 65.3% |
| Guyanese | 98.8 /100 | #93 | Exceptional 65.3% |
| Immigrants | Poland | 98.7 /100 | #94 | Exceptional 65.2% |
| Immigrants | Portugal | 98.6 /100 | #95 | Exceptional 65.2% |
| Swiss | 98.6 /100 | #96 | Exceptional 65.2% |
| Guatemalans | 98.6 /100 | #97 | Exceptional 65.2% |
| Immigrants | Syria | 98.4 /100 | #98 | Exceptional 65.2% |
| Central American Indians | 98.3 /100 | #99 | Exceptional 65.2% |
Demographics Similar to Immigrants from Northern Africa by Family Households
In terms of family households, the demographic groups most similar to Immigrants from Northern Africa are Immigrants from Armenia (63.5%, a difference of 0.010%), Immigrants from Greece (63.5%, a difference of 0.030%), Finnish (63.5%, a difference of 0.040%), Immigrants from Brazil (63.6%, a difference of 0.050%), and Albanian (63.5%, a difference of 0.070%).
| Demographics | Rating | Rank | Family Households |
| Immigrants | Hungary | 4.3 /100 | #225 | Tragic 63.6% |
| Immigrants | Bahamas | 4.2 /100 | #226 | Tragic 63.6% |
| Trinidadians and Tobagonians | 4.1 /100 | #227 | Tragic 63.6% |
| Blackfeet | 3.6 /100 | #228 | Tragic 63.6% |
| Bulgarians | 3.4 /100 | #229 | Tragic 63.6% |
| Immigrants | Brazil | 3.0 /100 | #230 | Tragic 63.6% |
| Immigrants | Greece | 2.9 /100 | #231 | Tragic 63.5% |
| Immigrants | Northern Africa | 2.6 /100 | #232 | Tragic 63.5% |
| Immigrants | Armenia | 2.6 /100 | #233 | Tragic 63.5% |
| Finns | 2.3 /100 | #234 | Tragic 63.5% |
| Albanians | 2.2 /100 | #235 | Tragic 63.5% |
| Ghanaians | 2.1 /100 | #236 | Tragic 63.5% |
| Comanche | 2.1 /100 | #237 | Tragic 63.5% |
| Immigrants | Zimbabwe | 2.0 /100 | #238 | Tragic 63.5% |
| Aleuts | 1.9 /100 | #239 | Tragic 63.4% |