Mexican American Indian vs Immigrants from Northern Africa Family Households
COMPARE
Mexican American Indian
Immigrants from Northern Africa
Family Households
Family Households Comparison
Mexican American Indians
Immigrants from Northern Africa
67.0%
FAMILY HOUSEHOLDS
100.0/ 100
METRIC RATING
38th/ 347
METRIC RANK
63.5%
FAMILY HOUSEHOLDS
2.6/ 100
METRIC RATING
232nd/ 347
METRIC RANK
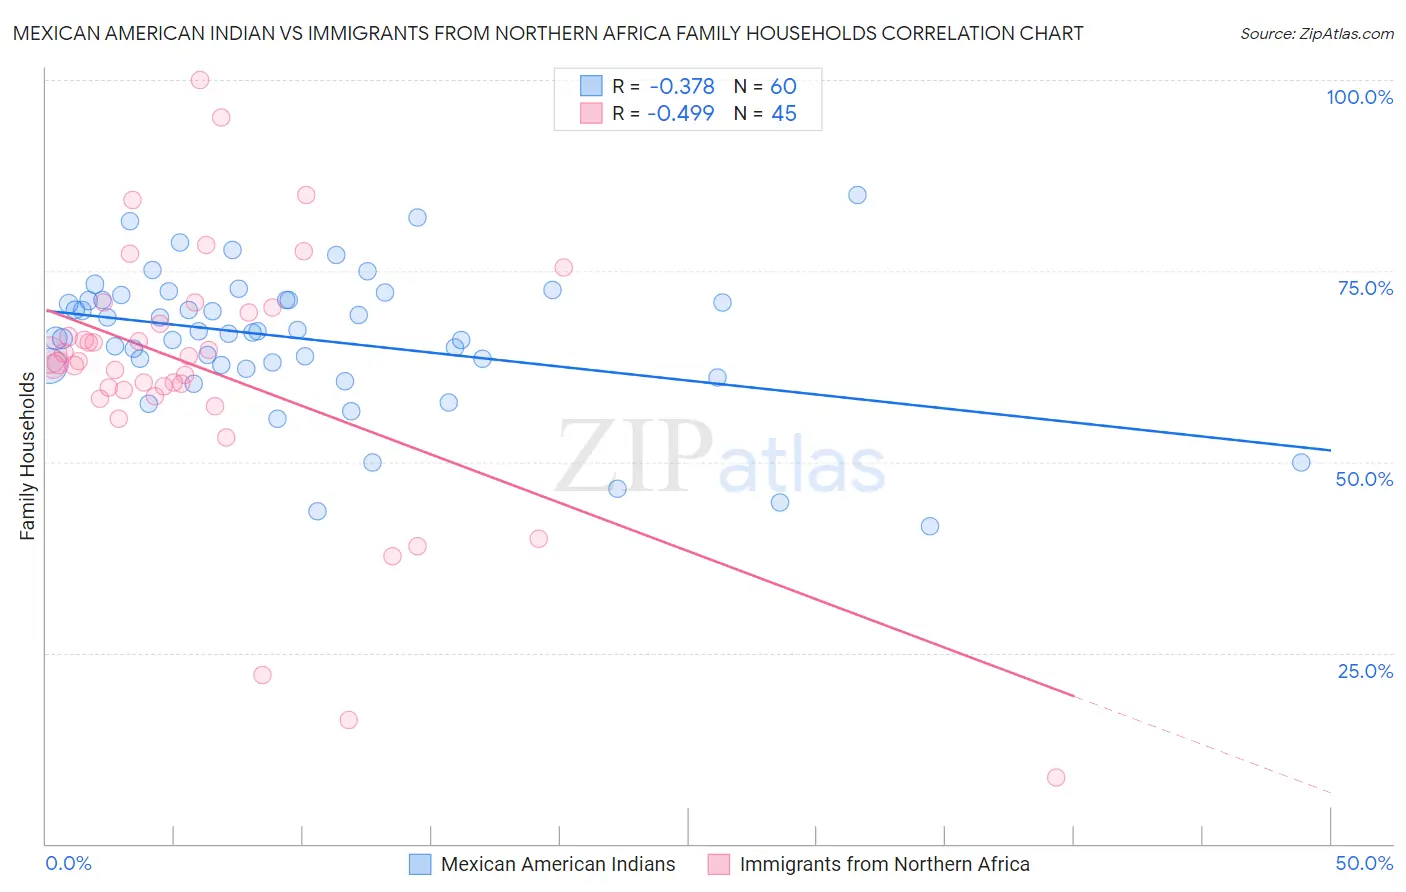
Mexican American Indian vs Immigrants from Northern Africa Family Households Correlation Chart
The statistical analysis conducted on geographies consisting of 317,495,580 people shows a mild negative correlation between the proportion of Mexican American Indians and percentage of family households in the United States with a correlation coefficient (R) of -0.378 and weighted average of 67.0%. Similarly, the statistical analysis conducted on geographies consisting of 321,089,077 people shows a moderate negative correlation between the proportion of Immigrants from Northern Africa and percentage of family households in the United States with a correlation coefficient (R) of -0.499 and weighted average of 63.5%, a difference of 5.5%.
Family Households Correlation Summary
| Measurement | Mexican American Indian | Immigrants from Northern Africa |
| Minimum | 41.6% | 8.7% |
| Maximum | 85.0% | 100.0% |
| Range | 43.4% | 91.3% |
| Mean | 66.1% | 62.0% |
| Median | 67.0% | 63.2% |
| Interquartile 25% (IQ1) | 62.6% | 59.0% |
| Interquartile 75% (IQ3) | 71.3% | 69.9% |
| Interquartile Range (IQR) | 8.6% | 10.8% |
| Standard Deviation (Sample) | 9.1% | 17.3% |
| Standard Deviation (Population) | 9.0% | 17.2% |
Similar Demographics by Family Households
Demographics Similar to Mexican American Indians by Family Households
In terms of family households, the demographic groups most similar to Mexican American Indians are Immigrants from El Salvador (67.0%, a difference of 0.020%), Tsimshian (67.1%, a difference of 0.10%), Peruvian (67.1%, a difference of 0.17%), Tohono O'odham (67.1%, a difference of 0.18%), and Salvadoran (67.2%, a difference of 0.23%).
| Demographics | Rating | Rank | Family Households |
| Immigrants | Latin America | 100.0 /100 | #31 | Exceptional 67.2% |
| Nepalese | 100.0 /100 | #32 | Exceptional 67.2% |
| Salvadorans | 100.0 /100 | #33 | Exceptional 67.2% |
| Thais | 100.0 /100 | #34 | Exceptional 67.2% |
| Tohono O'odham | 100.0 /100 | #35 | Exceptional 67.1% |
| Peruvians | 100.0 /100 | #36 | Exceptional 67.1% |
| Tsimshian | 100.0 /100 | #37 | Exceptional 67.1% |
| Mexican American Indians | 100.0 /100 | #38 | Exceptional 67.0% |
| Immigrants | El Salvador | 100.0 /100 | #39 | Exceptional 67.0% |
| Guamanians/Chamorros | 100.0 /100 | #40 | Exceptional 66.6% |
| Immigrants | Bolivia | 100.0 /100 | #41 | Exceptional 66.6% |
| Menominee | 100.0 /100 | #42 | Exceptional 66.5% |
| Apache | 100.0 /100 | #43 | Exceptional 66.5% |
| Asians | 100.0 /100 | #44 | Exceptional 66.5% |
| Venezuelans | 100.0 /100 | #45 | Exceptional 66.5% |
Demographics Similar to Immigrants from Northern Africa by Family Households
In terms of family households, the demographic groups most similar to Immigrants from Northern Africa are Immigrants from Armenia (63.5%, a difference of 0.010%), Immigrants from Greece (63.5%, a difference of 0.030%), Finnish (63.5%, a difference of 0.040%), Immigrants from Brazil (63.6%, a difference of 0.050%), and Albanian (63.5%, a difference of 0.070%).
| Demographics | Rating | Rank | Family Households |
| Immigrants | Hungary | 4.3 /100 | #225 | Tragic 63.6% |
| Immigrants | Bahamas | 4.2 /100 | #226 | Tragic 63.6% |
| Trinidadians and Tobagonians | 4.1 /100 | #227 | Tragic 63.6% |
| Blackfeet | 3.6 /100 | #228 | Tragic 63.6% |
| Bulgarians | 3.4 /100 | #229 | Tragic 63.6% |
| Immigrants | Brazil | 3.0 /100 | #230 | Tragic 63.6% |
| Immigrants | Greece | 2.9 /100 | #231 | Tragic 63.5% |
| Immigrants | Northern Africa | 2.6 /100 | #232 | Tragic 63.5% |
| Immigrants | Armenia | 2.6 /100 | #233 | Tragic 63.5% |
| Finns | 2.3 /100 | #234 | Tragic 63.5% |
| Albanians | 2.2 /100 | #235 | Tragic 63.5% |
| Ghanaians | 2.1 /100 | #236 | Tragic 63.5% |
| Comanche | 2.1 /100 | #237 | Tragic 63.5% |
| Immigrants | Zimbabwe | 2.0 /100 | #238 | Tragic 63.5% |
| Aleuts | 1.9 /100 | #239 | Tragic 63.4% |