Honduran vs Immigrants from Northern Africa Family Households
COMPARE
Honduran
Immigrants from Northern Africa
Family Households
Family Households Comparison
Hondurans
Immigrants from Northern Africa
64.4%
FAMILY HOUSEHOLDS
57.5/ 100
METRIC RATING
168th/ 347
METRIC RANK
63.5%
FAMILY HOUSEHOLDS
2.6/ 100
METRIC RATING
232nd/ 347
METRIC RANK
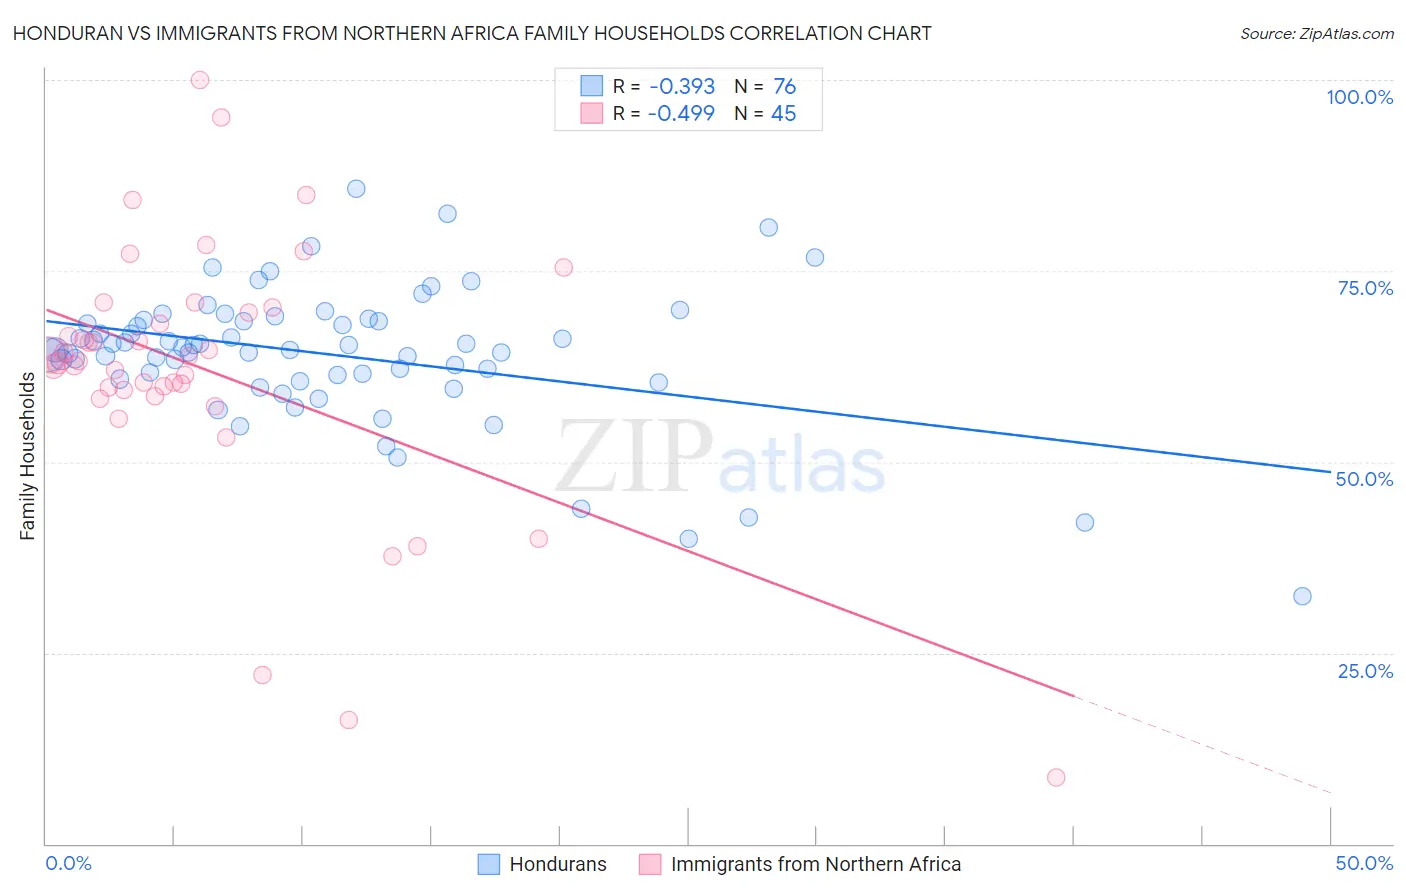
Honduran vs Immigrants from Northern Africa Family Households Correlation Chart
The statistical analysis conducted on geographies consisting of 357,606,635 people shows a mild negative correlation between the proportion of Hondurans and percentage of family households in the United States with a correlation coefficient (R) of -0.393 and weighted average of 64.4%. Similarly, the statistical analysis conducted on geographies consisting of 321,089,077 people shows a moderate negative correlation between the proportion of Immigrants from Northern Africa and percentage of family households in the United States with a correlation coefficient (R) of -0.499 and weighted average of 63.5%, a difference of 1.3%.
Family Households Correlation Summary
| Measurement | Honduran | Immigrants from Northern Africa |
| Minimum | 32.4% | 8.7% |
| Maximum | 85.8% | 100.0% |
| Range | 53.5% | 91.3% |
| Mean | 64.1% | 62.0% |
| Median | 64.8% | 63.2% |
| Interquartile 25% (IQ1) | 61.2% | 59.0% |
| Interquartile 75% (IQ3) | 68.5% | 69.9% |
| Interquartile Range (IQR) | 7.3% | 10.8% |
| Standard Deviation (Sample) | 9.1% | 17.3% |
| Standard Deviation (Population) | 9.0% | 17.2% |
Similar Demographics by Family Households
Demographics Similar to Hondurans by Family Households
In terms of family households, the demographic groups most similar to Hondurans are Irish (64.4%, a difference of 0.010%), Scotch-Irish (64.4%, a difference of 0.020%), Iraqi (64.4%, a difference of 0.020%), Armenian (64.4%, a difference of 0.020%), and Immigrants from Nigeria (64.4%, a difference of 0.040%).
| Demographics | Rating | Rank | Family Households |
| Immigrants | England | 62.6 /100 | #161 | Good 64.4% |
| British | 61.6 /100 | #162 | Good 64.4% |
| Chickasaw | 61.5 /100 | #163 | Good 64.4% |
| Immigrants | Nigeria | 60.1 /100 | #164 | Good 64.4% |
| Immigrants | Southern Europe | 60.0 /100 | #165 | Good 64.4% |
| Scotch-Irish | 59.2 /100 | #166 | Average 64.4% |
| Irish | 57.9 /100 | #167 | Average 64.4% |
| Hondurans | 57.5 /100 | #168 | Average 64.4% |
| Iraqis | 56.0 /100 | #169 | Average 64.4% |
| Armenians | 55.9 /100 | #170 | Average 64.4% |
| Ute | 54.6 /100 | #171 | Average 64.3% |
| Dutch West Indians | 53.9 /100 | #172 | Average 64.3% |
| Immigrants | Sierra Leone | 52.5 /100 | #173 | Average 64.3% |
| Immigrants | Germany | 50.0 /100 | #174 | Average 64.3% |
| Bangladeshis | 44.3 /100 | #175 | Average 64.3% |
Demographics Similar to Immigrants from Northern Africa by Family Households
In terms of family households, the demographic groups most similar to Immigrants from Northern Africa are Immigrants from Armenia (63.5%, a difference of 0.010%), Immigrants from Greece (63.5%, a difference of 0.030%), Finnish (63.5%, a difference of 0.040%), Immigrants from Brazil (63.6%, a difference of 0.050%), and Albanian (63.5%, a difference of 0.070%).
| Demographics | Rating | Rank | Family Households |
| Immigrants | Hungary | 4.3 /100 | #225 | Tragic 63.6% |
| Immigrants | Bahamas | 4.2 /100 | #226 | Tragic 63.6% |
| Trinidadians and Tobagonians | 4.1 /100 | #227 | Tragic 63.6% |
| Blackfeet | 3.6 /100 | #228 | Tragic 63.6% |
| Bulgarians | 3.4 /100 | #229 | Tragic 63.6% |
| Immigrants | Brazil | 3.0 /100 | #230 | Tragic 63.6% |
| Immigrants | Greece | 2.9 /100 | #231 | Tragic 63.5% |
| Immigrants | Northern Africa | 2.6 /100 | #232 | Tragic 63.5% |
| Immigrants | Armenia | 2.6 /100 | #233 | Tragic 63.5% |
| Finns | 2.3 /100 | #234 | Tragic 63.5% |
| Albanians | 2.2 /100 | #235 | Tragic 63.5% |
| Ghanaians | 2.1 /100 | #236 | Tragic 63.5% |
| Comanche | 2.1 /100 | #237 | Tragic 63.5% |
| Immigrants | Zimbabwe | 2.0 /100 | #238 | Tragic 63.5% |
| Aleuts | 1.9 /100 | #239 | Tragic 63.4% |