Palestinian vs Ethiopian Currently Married
COMPARE
Palestinian
Ethiopian
Currently Married
Currently Married Comparison
Palestinians
Ethiopians
47.6%
CURRENTLY MARRIED
90.4/ 100
METRIC RATING
116th/ 347
METRIC RANK
44.5%
CURRENTLY MARRIED
0.7/ 100
METRIC RATING
241st/ 347
METRIC RANK
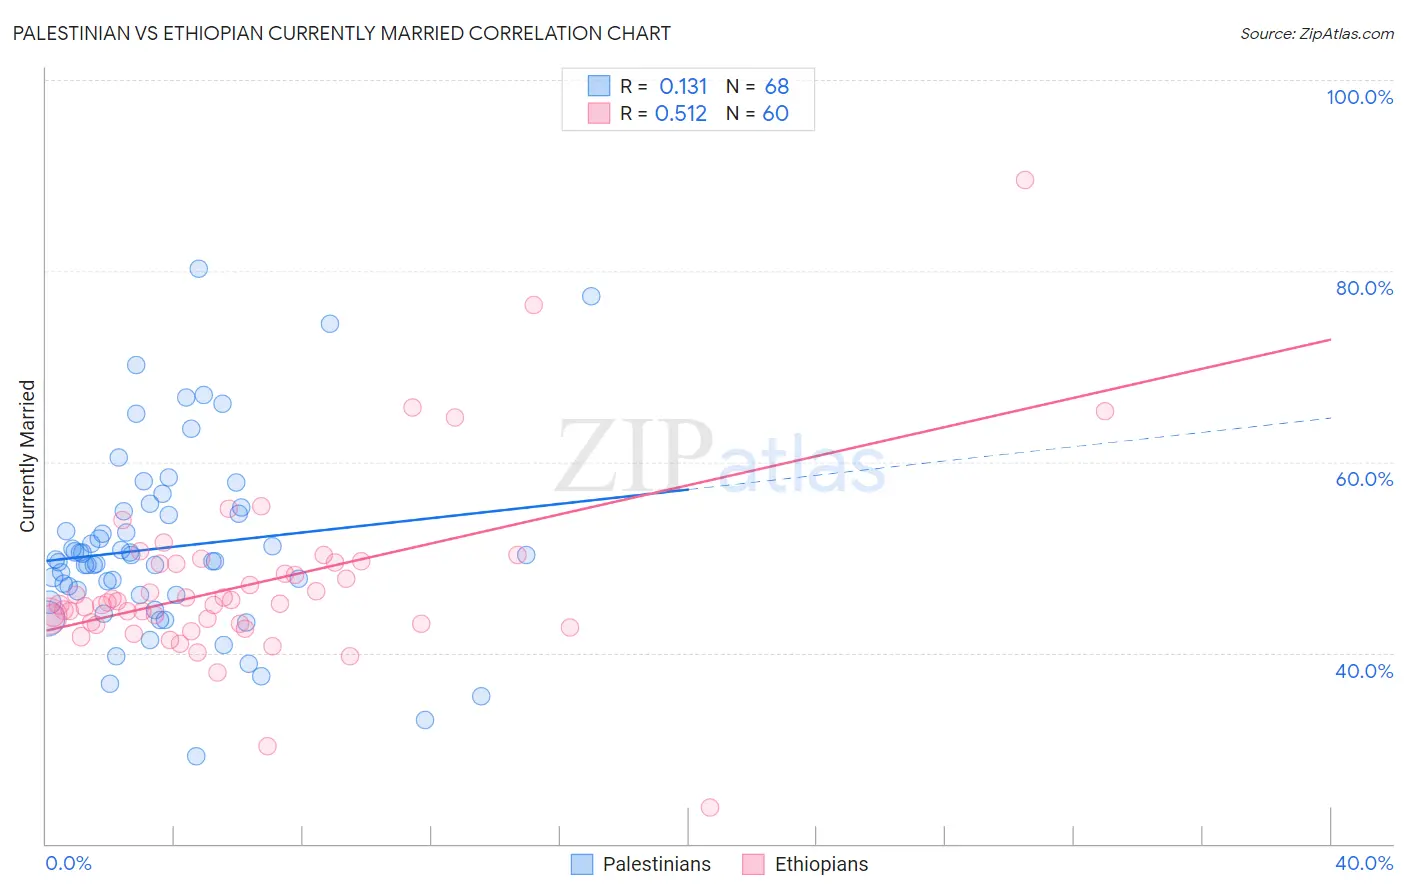
Palestinian vs Ethiopian Currently Married Correlation Chart
The statistical analysis conducted on geographies consisting of 216,437,079 people shows a poor positive correlation between the proportion of Palestinians and percentage of population currently married in the United States with a correlation coefficient (R) of 0.131 and weighted average of 47.6%. Similarly, the statistical analysis conducted on geographies consisting of 223,255,094 people shows a substantial positive correlation between the proportion of Ethiopians and percentage of population currently married in the United States with a correlation coefficient (R) of 0.512 and weighted average of 44.5%, a difference of 6.9%.
Currently Married Correlation Summary
| Measurement | Palestinian | Ethiopian |
| Minimum | 29.1% | 23.8% |
| Maximum | 80.2% | 89.5% |
| Range | 51.1% | 65.7% |
| Mean | 51.0% | 47.3% |
| Median | 49.7% | 45.2% |
| Interquartile 25% (IQ1) | 46.0% | 43.0% |
| Interquartile 75% (IQ3) | 54.7% | 49.4% |
| Interquartile Range (IQR) | 8.7% | 6.3% |
| Standard Deviation (Sample) | 9.7% | 9.5% |
| Standard Deviation (Population) | 9.7% | 9.4% |
Similar Demographics by Currently Married
Demographics Similar to Palestinians by Currently Married
In terms of currently married, the demographic groups most similar to Palestinians are South African (47.6%, a difference of 0.010%), Immigrants from Indonesia (47.6%, a difference of 0.010%), Puget Sound Salish (47.6%, a difference of 0.020%), Immigrants from Philippines (47.6%, a difference of 0.020%), and Australian (47.6%, a difference of 0.020%).
| Demographics | Rating | Rank | Currently Married |
| Immigrants | Egypt | 92.3 /100 | #109 | Exceptional 47.7% |
| Immigrants | Russia | 92.0 /100 | #110 | Exceptional 47.7% |
| Immigrants | Hungary | 91.2 /100 | #111 | Exceptional 47.6% |
| Immigrants | Western Europe | 91.1 /100 | #112 | Exceptional 47.6% |
| Immigrants | Denmark | 90.9 /100 | #113 | Exceptional 47.6% |
| South Africans | 90.5 /100 | #114 | Exceptional 47.6% |
| Immigrants | Indonesia | 90.5 /100 | #115 | Exceptional 47.6% |
| Palestinians | 90.4 /100 | #116 | Exceptional 47.6% |
| Puget Sound Salish | 90.3 /100 | #117 | Exceptional 47.6% |
| Immigrants | Philippines | 90.2 /100 | #118 | Exceptional 47.6% |
| Australians | 90.2 /100 | #119 | Exceptional 47.6% |
| Syrians | 88.9 /100 | #120 | Excellent 47.5% |
| Immigrants | Croatia | 88.6 /100 | #121 | Excellent 47.5% |
| Osage | 87.9 /100 | #122 | Excellent 47.5% |
| Immigrants | Kazakhstan | 87.2 /100 | #123 | Excellent 47.4% |
Demographics Similar to Ethiopians by Currently Married
In terms of currently married, the demographic groups most similar to Ethiopians are Immigrants from Cambodia (44.5%, a difference of 0.030%), Immigrants from Ethiopia (44.5%, a difference of 0.040%), Immigrants from Mexico (44.5%, a difference of 0.060%), Mexican American Indian (44.5%, a difference of 0.060%), and Japanese (44.5%, a difference of 0.12%).
| Demographics | Rating | Rank | Currently Married |
| Iroquois | 1.1 /100 | #234 | Tragic 44.7% |
| Alaskan Athabascans | 0.9 /100 | #235 | Tragic 44.6% |
| Cubans | 0.9 /100 | #236 | Tragic 44.6% |
| Seminole | 0.9 /100 | #237 | Tragic 44.6% |
| Moroccans | 0.9 /100 | #238 | Tragic 44.6% |
| Immigrants | Mexico | 0.7 /100 | #239 | Tragic 44.5% |
| Mexican American Indians | 0.7 /100 | #240 | Tragic 44.5% |
| Ethiopians | 0.7 /100 | #241 | Tragic 44.5% |
| Immigrants | Cambodia | 0.7 /100 | #242 | Tragic 44.5% |
| Immigrants | Ethiopia | 0.7 /100 | #243 | Tragic 44.5% |
| Japanese | 0.6 /100 | #244 | Tragic 44.5% |
| Immigrants | Armenia | 0.4 /100 | #245 | Tragic 44.3% |
| Immigrants | Burma/Myanmar | 0.4 /100 | #246 | Tragic 44.3% |
| Ugandans | 0.4 /100 | #247 | Tragic 44.2% |
| Nicaraguans | 0.3 /100 | #248 | Tragic 44.2% |