Paiute vs Immigrants from Ecuador 6th Grade
COMPARE
Paiute
Immigrants from Ecuador
6th Grade
6th Grade Comparison
Paiute
Immigrants from Ecuador
96.8%
6TH GRADE
7.8/ 100
METRIC RATING
216th/ 347
METRIC RANK
95.3%
6TH GRADE
0.0/ 100
METRIC RATING
320th/ 347
METRIC RANK
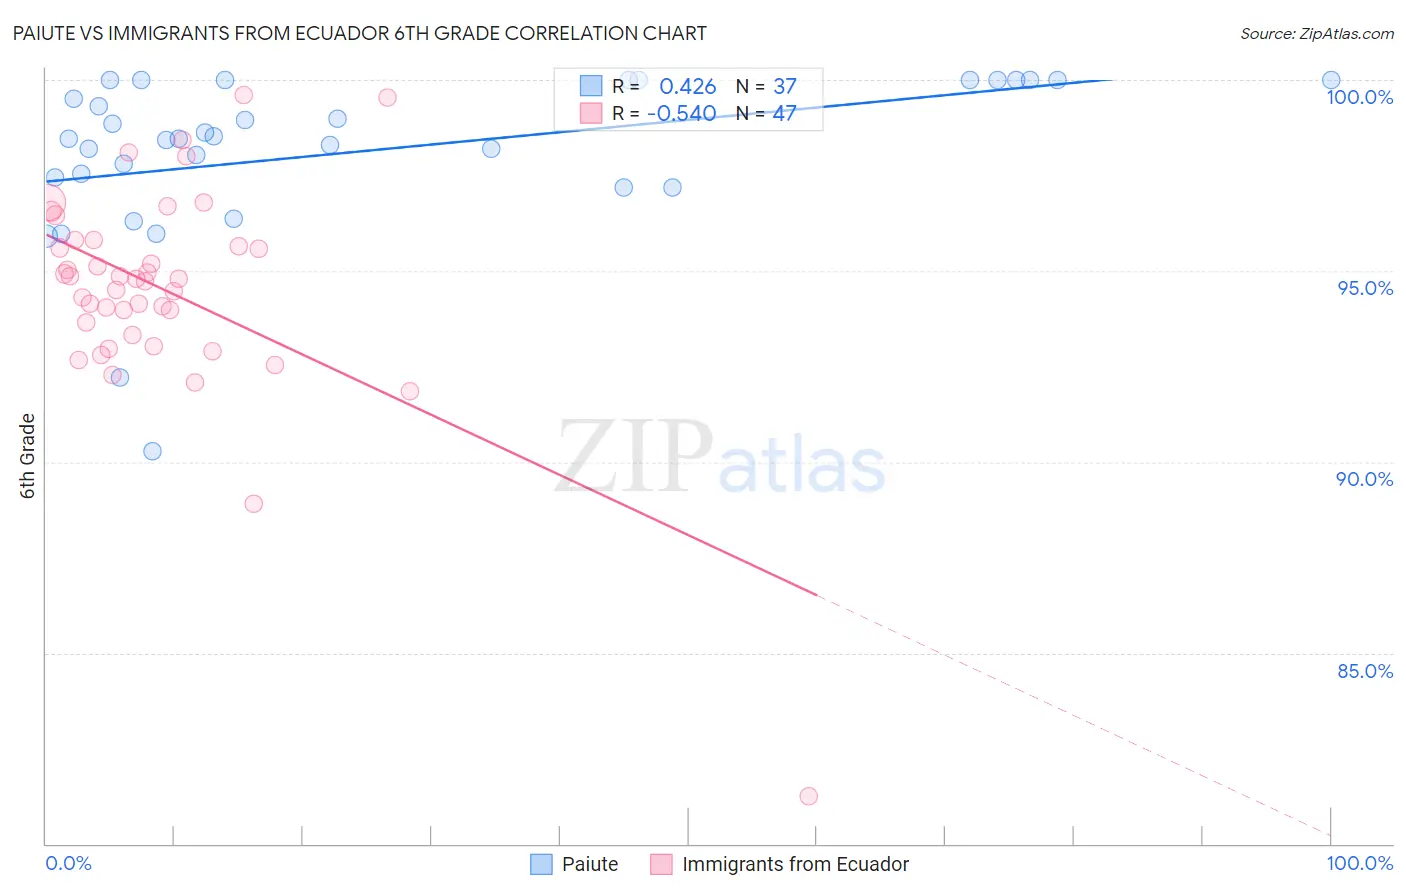
Paiute vs Immigrants from Ecuador 6th Grade Correlation Chart
The statistical analysis conducted on geographies consisting of 58,402,332 people shows a moderate positive correlation between the proportion of Paiute and percentage of population with at least 6th grade education in the United States with a correlation coefficient (R) of 0.426 and weighted average of 96.8%. Similarly, the statistical analysis conducted on geographies consisting of 271,020,679 people shows a substantial negative correlation between the proportion of Immigrants from Ecuador and percentage of population with at least 6th grade education in the United States with a correlation coefficient (R) of -0.540 and weighted average of 95.3%, a difference of 1.6%.
6th Grade Correlation Summary
| Measurement | Paiute | Immigrants from Ecuador |
| Minimum | 90.3% | 81.2% |
| Maximum | 100.0% | 99.6% |
| Range | 9.7% | 18.3% |
| Mean | 98.1% | 94.5% |
| Median | 98.5% | 94.8% |
| Interquartile 25% (IQ1) | 97.3% | 93.3% |
| Interquartile 75% (IQ3) | 100.0% | 95.8% |
| Interquartile Range (IQR) | 2.7% | 2.5% |
| Standard Deviation (Sample) | 2.1% | 2.8% |
| Standard Deviation (Population) | 2.1% | 2.8% |
Similar Demographics by 6th Grade
Demographics Similar to Paiute by 6th Grade
In terms of 6th grade, the demographic groups most similar to Paiute are Sierra Leonean (96.8%, a difference of 0.0%), Immigrants from Sudan (96.8%, a difference of 0.010%), Portuguese (96.8%, a difference of 0.010%), Liberian (96.8%, a difference of 0.010%), and Navajo (96.8%, a difference of 0.010%).
| Demographics | Rating | Rank | 6th Grade |
| Immigrants | Oceania | 11.0 /100 | #209 | Poor 96.8% |
| Immigrants | Nepal | 10.1 /100 | #210 | Poor 96.8% |
| Immigrants | Iraq | 9.2 /100 | #211 | Tragic 96.8% |
| Moroccans | 9.0 /100 | #212 | Tragic 96.8% |
| Immigrants | Sudan | 8.7 /100 | #213 | Tragic 96.8% |
| Portuguese | 8.2 /100 | #214 | Tragic 96.8% |
| Sierra Leoneans | 8.0 /100 | #215 | Tragic 96.8% |
| Paiute | 7.8 /100 | #216 | Tragic 96.8% |
| Liberians | 7.5 /100 | #217 | Tragic 96.8% |
| Navajo | 7.3 /100 | #218 | Tragic 96.8% |
| Costa Ricans | 6.8 /100 | #219 | Tragic 96.8% |
| Immigrants | Morocco | 6.2 /100 | #220 | Tragic 96.7% |
| Tongans | 6.1 /100 | #221 | Tragic 96.7% |
| Immigrants | Syria | 5.9 /100 | #222 | Tragic 96.7% |
| Bahamians | 4.8 /100 | #223 | Tragic 96.7% |
Demographics Similar to Immigrants from Ecuador by 6th Grade
In terms of 6th grade, the demographic groups most similar to Immigrants from Ecuador are Immigrants from Belize (95.3%, a difference of 0.030%), Belizean (95.3%, a difference of 0.040%), Vietnamese (95.3%, a difference of 0.060%), Immigrants from Fiji (95.2%, a difference of 0.060%), and Japanese (95.4%, a difference of 0.10%).
| Demographics | Rating | Rank | 6th Grade |
| Nicaraguans | 0.0 /100 | #313 | Tragic 95.4% |
| Immigrants | Vietnam | 0.0 /100 | #314 | Tragic 95.4% |
| Immigrants | Bangladesh | 0.0 /100 | #315 | Tragic 95.4% |
| Japanese | 0.0 /100 | #316 | Tragic 95.4% |
| Vietnamese | 0.0 /100 | #317 | Tragic 95.3% |
| Belizeans | 0.0 /100 | #318 | Tragic 95.3% |
| Immigrants | Belize | 0.0 /100 | #319 | Tragic 95.3% |
| Immigrants | Ecuador | 0.0 /100 | #320 | Tragic 95.3% |
| Immigrants | Fiji | 0.0 /100 | #321 | Tragic 95.2% |
| Immigrants | Cambodia | 0.0 /100 | #322 | Tragic 95.2% |
| Central American Indians | 0.0 /100 | #323 | Tragic 95.1% |
| Cape Verdeans | 0.0 /100 | #324 | Tragic 95.1% |
| Immigrants | Nicaragua | 0.0 /100 | #325 | Tragic 95.1% |
| Hispanics or Latinos | 0.0 /100 | #326 | Tragic 95.0% |
| Mexican American Indians | 0.0 /100 | #327 | Tragic 95.0% |