Blackfeet vs Arapaho Divorced or Separated
COMPARE
Blackfeet
Arapaho
Divorced or Separated
Divorced or Separated Comparison
Blackfeet
Arapaho
13.3%
DIVORCED OR SEPARATED
0.0/ 100
METRIC RATING
312th/ 347
METRIC RANK
14.8%
DIVORCED OR SEPARATED
0.0/ 100
METRIC RATING
346th/ 347
METRIC RANK
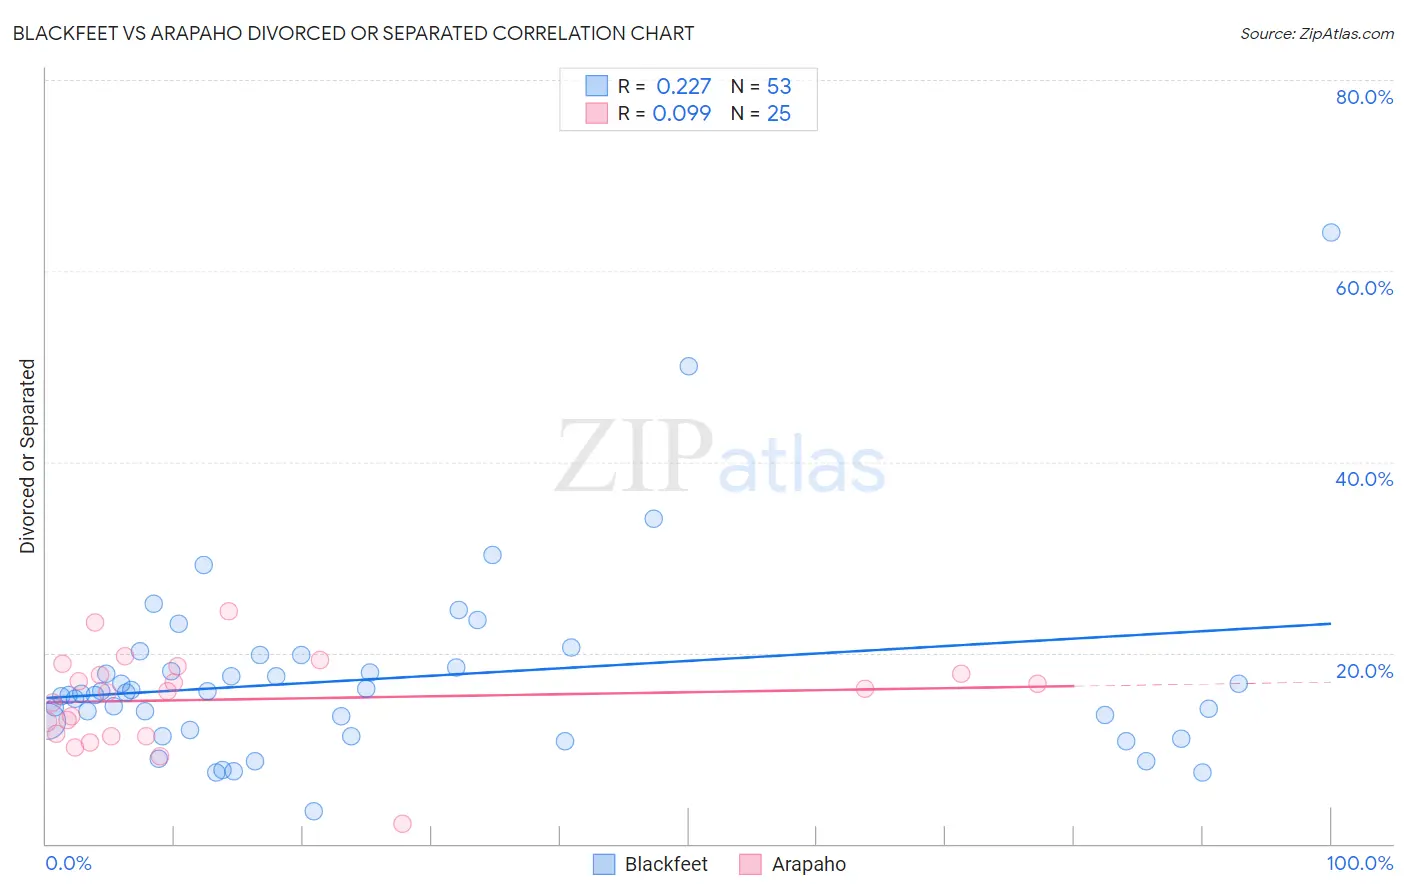
Blackfeet vs Arapaho Divorced or Separated Correlation Chart
The statistical analysis conducted on geographies consisting of 309,547,647 people shows a weak positive correlation between the proportion of Blackfeet and percentage of population currently divorced or separated in the United States with a correlation coefficient (R) of 0.227 and weighted average of 13.3%. Similarly, the statistical analysis conducted on geographies consisting of 29,779,242 people shows a slight positive correlation between the proportion of Arapaho and percentage of population currently divorced or separated in the United States with a correlation coefficient (R) of 0.099 and weighted average of 14.8%, a difference of 11.6%.
Divorced or Separated Correlation Summary
| Measurement | Blackfeet | Arapaho |
| Minimum | 3.4% | 2.1% |
| Maximum | 64.0% | 24.4% |
| Range | 60.6% | 22.3% |
| Mean | 17.3% | 15.1% |
| Median | 15.7% | 15.9% |
| Interquartile 25% (IQ1) | 11.6% | 11.4% |
| Interquartile 75% (IQ3) | 19.1% | 18.2% |
| Interquartile Range (IQR) | 7.6% | 6.8% |
| Standard Deviation (Sample) | 10.0% | 4.8% |
| Standard Deviation (Population) | 9.9% | 4.7% |
Similar Demographics by Divorced or Separated
Demographics Similar to Blackfeet by Divorced or Separated
In terms of divorced or separated, the demographic groups most similar to Blackfeet are Immigrants from Nicaragua (13.3%, a difference of 0.19%), Yaqui (13.3%, a difference of 0.21%), Sioux (13.2%, a difference of 0.35%), African (13.2%, a difference of 0.37%), and American (13.2%, a difference of 0.39%).
| Demographics | Rating | Rank | Divorced or Separated |
| Chippewa | 0.0 /100 | #305 | Tragic 13.2% |
| Tlingit-Haida | 0.0 /100 | #306 | Tragic 13.2% |
| French American Indians | 0.0 /100 | #307 | Tragic 13.2% |
| Ottawa | 0.0 /100 | #308 | Tragic 13.2% |
| Americans | 0.0 /100 | #309 | Tragic 13.2% |
| Africans | 0.0 /100 | #310 | Tragic 13.2% |
| Sioux | 0.0 /100 | #311 | Tragic 13.2% |
| Blackfeet | 0.0 /100 | #312 | Tragic 13.3% |
| Immigrants | Nicaragua | 0.0 /100 | #313 | Tragic 13.3% |
| Yaqui | 0.0 /100 | #314 | Tragic 13.3% |
| Spanish Americans | 0.0 /100 | #315 | Tragic 13.3% |
| Tsimshian | 0.0 /100 | #316 | Tragic 13.3% |
| Haitians | 0.0 /100 | #317 | Tragic 13.3% |
| Cree | 0.0 /100 | #318 | Tragic 13.4% |
| Puget Sound Salish | 0.0 /100 | #319 | Tragic 13.4% |
Demographics Similar to Arapaho by Divorced or Separated
In terms of divorced or separated, the demographic groups most similar to Arapaho are Kiowa (14.5%, a difference of 2.1%), Cuban (14.5%, a difference of 2.2%), Immigrants from Cuba (15.2%, a difference of 2.8%), Creek (14.4%, a difference of 2.9%), and Seminole (14.3%, a difference of 3.9%).
| Demographics | Rating | Rank | Divorced or Separated |
| Puerto Ricans | 0.0 /100 | #333 | Tragic 13.9% |
| Immigrants | Bahamas | 0.0 /100 | #334 | Tragic 13.9% |
| Dutch West Indians | 0.0 /100 | #335 | Tragic 14.0% |
| Shoshone | 0.0 /100 | #336 | Tragic 14.0% |
| Crow | 0.0 /100 | #337 | Tragic 14.1% |
| Choctaw | 0.0 /100 | #338 | Tragic 14.1% |
| Colville | 0.0 /100 | #339 | Tragic 14.2% |
| Chickasaw | 0.0 /100 | #340 | Tragic 14.2% |
| Bahamians | 0.0 /100 | #341 | Tragic 14.2% |
| Seminole | 0.0 /100 | #342 | Tragic 14.3% |
| Creek | 0.0 /100 | #343 | Tragic 14.4% |
| Cubans | 0.0 /100 | #344 | Tragic 14.5% |
| Kiowa | 0.0 /100 | #345 | Tragic 14.5% |
| Arapaho | 0.0 /100 | #346 | Tragic 14.8% |
| Immigrants | Cuba | 0.0 /100 | #347 | Tragic 15.2% |