Ottawa vs Immigrants from Kazakhstan Average Family Size
COMPARE
Ottawa
Immigrants from Kazakhstan
Average Family Size
Average Family Size Comparison
Ottawa
Immigrants from Kazakhstan
3.11
AVERAGE FAMILY SIZE
0.0/ 100
METRIC RATING
326th/ 347
METRIC RANK
3.17
AVERAGE FAMILY SIZE
1.5/ 100
METRIC RATING
256th/ 347
METRIC RANK
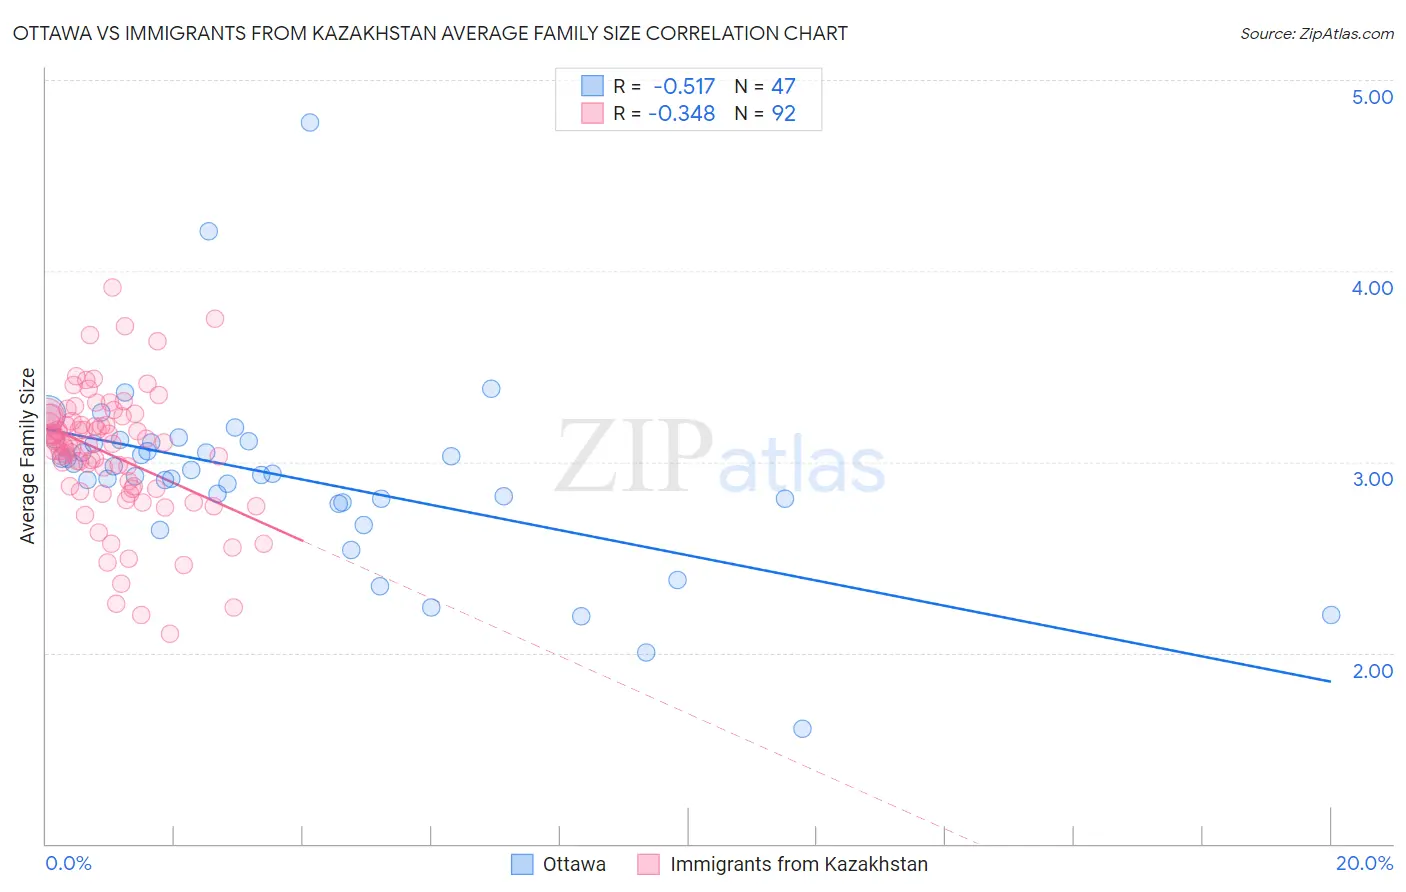
Ottawa vs Immigrants from Kazakhstan Average Family Size Correlation Chart
The statistical analysis conducted on geographies consisting of 49,944,420 people shows a substantial negative correlation between the proportion of Ottawa and average family size in the United States with a correlation coefficient (R) of -0.517 and weighted average of 3.11. Similarly, the statistical analysis conducted on geographies consisting of 124,429,118 people shows a mild negative correlation between the proportion of Immigrants from Kazakhstan and average family size in the United States with a correlation coefficient (R) of -0.348 and weighted average of 3.17, a difference of 1.9%.
Average Family Size Correlation Summary
| Measurement | Ottawa | Immigrants from Kazakhstan |
| Minimum | 1.60 | 2.10 |
| Maximum | 4.78 | 3.91 |
| Range | 3.18 | 1.81 |
| Mean | 2.92 | 3.04 |
| Median | 2.94 | 3.09 |
| Interquartile 25% (IQ1) | 2.79 | 2.86 |
| Interquartile 75% (IQ3) | 3.10 | 3.23 |
| Interquartile Range (IQR) | 0.31 | 0.37 |
| Standard Deviation (Sample) | 0.49 | 0.34 |
| Standard Deviation (Population) | 0.49 | 0.33 |
Similar Demographics by Average Family Size
Demographics Similar to Ottawa by Average Family Size
In terms of average family size, the demographic groups most similar to Ottawa are Dutch (3.11, a difference of 0.010%), Czech (3.11, a difference of 0.010%), English (3.11, a difference of 0.050%), Belgian (3.11, a difference of 0.070%), and Celtic (3.11, a difference of 0.090%).
| Demographics | Rating | Rank | Average Family Size |
| Welsh | 0.1 /100 | #319 | Tragic 3.12 |
| Immigrants | North America | 0.0 /100 | #320 | Tragic 3.12 |
| Immigrants | Austria | 0.0 /100 | #321 | Tragic 3.12 |
| Immigrants | Canada | 0.0 /100 | #322 | Tragic 3.12 |
| Soviet Union | 0.0 /100 | #323 | Tragic 3.11 |
| Celtics | 0.0 /100 | #324 | Tragic 3.11 |
| English | 0.0 /100 | #325 | Tragic 3.11 |
| Ottawa | 0.0 /100 | #326 | Tragic 3.11 |
| Dutch | 0.0 /100 | #327 | Tragic 3.11 |
| Czechs | 0.0 /100 | #328 | Tragic 3.11 |
| Belgians | 0.0 /100 | #329 | Tragic 3.11 |
| Latvians | 0.0 /100 | #330 | Tragic 3.11 |
| Scotch-Irish | 0.0 /100 | #331 | Tragic 3.11 |
| Scottish | 0.0 /100 | #332 | Tragic 3.11 |
| Estonians | 0.0 /100 | #333 | Tragic 3.10 |
Demographics Similar to Immigrants from Kazakhstan by Average Family Size
In terms of average family size, the demographic groups most similar to Immigrants from Kazakhstan are Albanian (3.17, a difference of 0.020%), Cape Verdean (3.17, a difference of 0.030%), South African (3.17, a difference of 0.040%), Immigrants from Hungary (3.17, a difference of 0.040%), and Immigrants from Saudi Arabia (3.17, a difference of 0.050%).
| Demographics | Rating | Rank | Average Family Size |
| Immigrants | Eastern Europe | 2.1 /100 | #249 | Tragic 3.17 |
| Puget Sound Salish | 1.9 /100 | #250 | Tragic 3.17 |
| Immigrants | Spain | 1.8 /100 | #251 | Tragic 3.17 |
| Immigrants | Saudi Arabia | 1.7 /100 | #252 | Tragic 3.17 |
| South Africans | 1.7 /100 | #253 | Tragic 3.17 |
| Immigrants | Hungary | 1.7 /100 | #254 | Tragic 3.17 |
| Cape Verdeans | 1.6 /100 | #255 | Tragic 3.17 |
| Immigrants | Kazakhstan | 1.5 /100 | #256 | Tragic 3.17 |
| Albanians | 1.5 /100 | #257 | Tragic 3.17 |
| Turks | 1.3 /100 | #258 | Tragic 3.16 |
| Potawatomi | 1.3 /100 | #259 | Tragic 3.16 |
| Immigrants | Albania | 1.3 /100 | #260 | Tragic 3.16 |
| Immigrants | North Macedonia | 1.3 /100 | #261 | Tragic 3.16 |
| Immigrants | Russia | 1.3 /100 | #262 | Tragic 3.16 |
| Immigrants | Bulgaria | 1.0 /100 | #263 | Tragic 3.16 |