Ottawa vs Immigrants from Poland Divorced or Separated
COMPARE
Ottawa
Immigrants from Poland
Divorced or Separated
Divorced or Separated Comparison
Ottawa
Immigrants from Poland
13.2%
DIVORCED OR SEPARATED
0.0/ 100
METRIC RATING
308th/ 347
METRIC RANK
11.2%
DIVORCED OR SEPARATED
100.0/ 100
METRIC RATING
47th/ 347
METRIC RANK
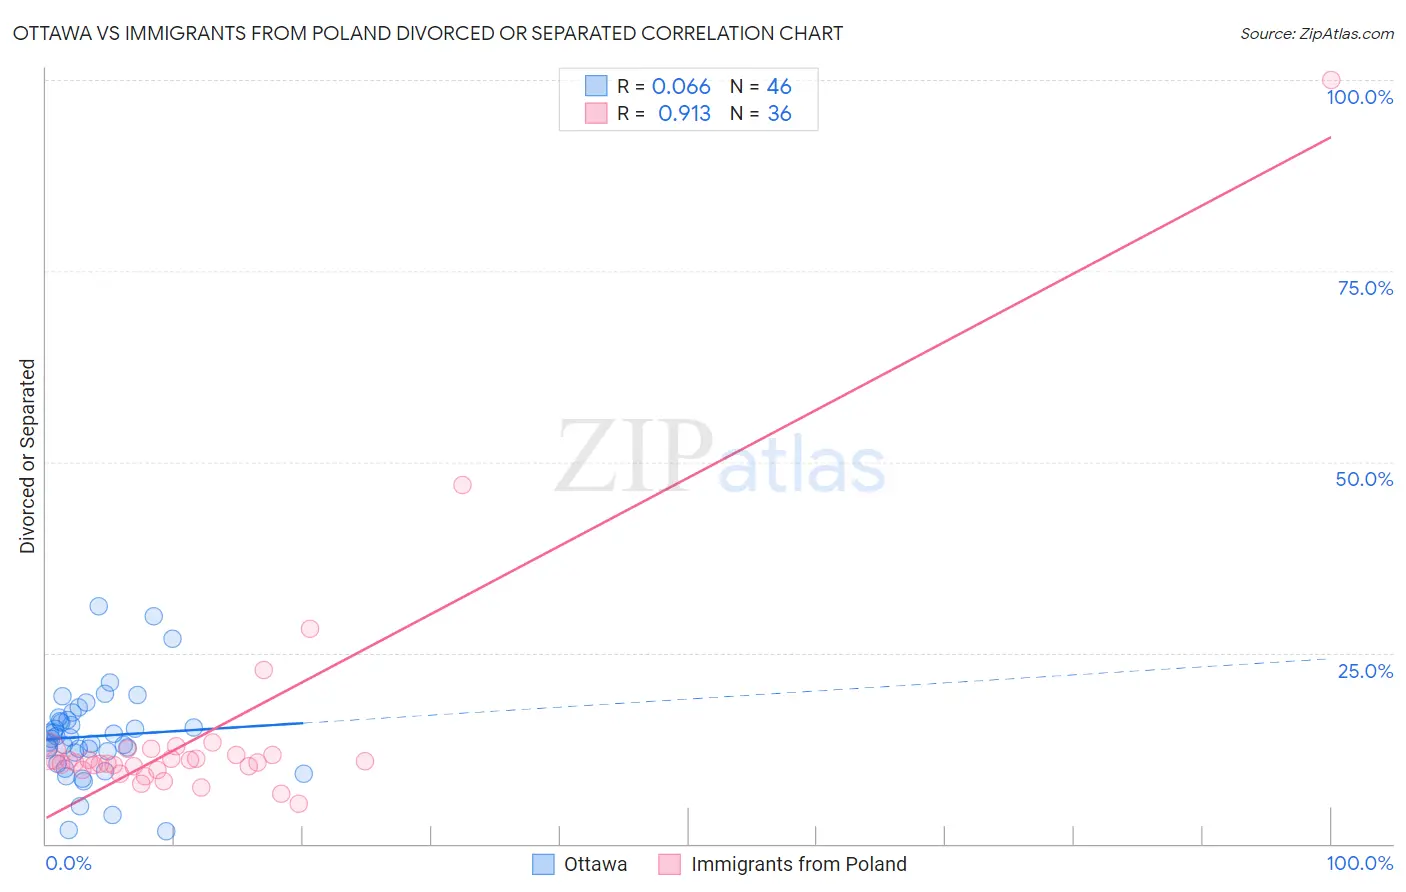
Ottawa vs Immigrants from Poland Divorced or Separated Correlation Chart
The statistical analysis conducted on geographies consisting of 49,956,568 people shows a slight positive correlation between the proportion of Ottawa and percentage of population currently divorced or separated in the United States with a correlation coefficient (R) of 0.066 and weighted average of 13.2%. Similarly, the statistical analysis conducted on geographies consisting of 304,831,025 people shows a near-perfect positive correlation between the proportion of Immigrants from Poland and percentage of population currently divorced or separated in the United States with a correlation coefficient (R) of 0.913 and weighted average of 11.2%, a difference of 18.1%.
Divorced or Separated Correlation Summary
| Measurement | Ottawa | Immigrants from Poland |
| Minimum | 1.6% | 5.2% |
| Maximum | 31.1% | 100.0% |
| Range | 29.5% | 94.8% |
| Mean | 14.1% | 14.6% |
| Median | 13.8% | 10.7% |
| Interquartile 25% (IQ1) | 11.9% | 9.9% |
| Interquartile 75% (IQ3) | 16.3% | 11.9% |
| Interquartile Range (IQR) | 4.4% | 2.0% |
| Standard Deviation (Sample) | 6.0% | 16.3% |
| Standard Deviation (Population) | 5.9% | 16.1% |
Similar Demographics by Divorced or Separated
Demographics Similar to Ottawa by Divorced or Separated
In terms of divorced or separated, the demographic groups most similar to Ottawa are American (13.2%, a difference of 0.010%), African (13.2%, a difference of 0.030%), Sioux (13.2%, a difference of 0.050%), French American Indian (13.2%, a difference of 0.090%), and Tlingit-Haida (13.2%, a difference of 0.34%).
| Demographics | Rating | Rank | Divorced or Separated |
| Alaskan Athabascans | 0.0 /100 | #301 | Tragic 13.1% |
| Immigrants | Venezuela | 0.0 /100 | #302 | Tragic 13.1% |
| Cape Verdeans | 0.0 /100 | #303 | Tragic 13.1% |
| Hopi | 0.0 /100 | #304 | Tragic 13.2% |
| Chippewa | 0.0 /100 | #305 | Tragic 13.2% |
| Tlingit-Haida | 0.0 /100 | #306 | Tragic 13.2% |
| French American Indians | 0.0 /100 | #307 | Tragic 13.2% |
| Ottawa | 0.0 /100 | #308 | Tragic 13.2% |
| Americans | 0.0 /100 | #309 | Tragic 13.2% |
| Africans | 0.0 /100 | #310 | Tragic 13.2% |
| Sioux | 0.0 /100 | #311 | Tragic 13.2% |
| Blackfeet | 0.0 /100 | #312 | Tragic 13.3% |
| Immigrants | Nicaragua | 0.0 /100 | #313 | Tragic 13.3% |
| Yaqui | 0.0 /100 | #314 | Tragic 13.3% |
| Spanish Americans | 0.0 /100 | #315 | Tragic 13.3% |
Demographics Similar to Immigrants from Poland by Divorced or Separated
In terms of divorced or separated, the demographic groups most similar to Immigrants from Poland are Laotian (11.2%, a difference of 0.010%), Immigrants from Turkey (11.2%, a difference of 0.030%), Immigrants from Saudi Arabia (11.2%, a difference of 0.040%), Bolivian (11.2%, a difference of 0.10%), and Turkish (11.2%, a difference of 0.12%).
| Demographics | Rating | Rank | Divorced or Separated |
| Soviet Union | 100.0 /100 | #40 | Exceptional 11.1% |
| Bhutanese | 100.0 /100 | #41 | Exceptional 11.2% |
| Chinese | 100.0 /100 | #42 | Exceptional 11.2% |
| Immigrants | Belarus | 100.0 /100 | #43 | Exceptional 11.2% |
| Immigrants | Western Asia | 100.0 /100 | #44 | Exceptional 11.2% |
| Turks | 100.0 /100 | #45 | Exceptional 11.2% |
| Laotians | 100.0 /100 | #46 | Exceptional 11.2% |
| Immigrants | Poland | 100.0 /100 | #47 | Exceptional 11.2% |
| Immigrants | Turkey | 100.0 /100 | #48 | Exceptional 11.2% |
| Immigrants | Saudi Arabia | 100.0 /100 | #49 | Exceptional 11.2% |
| Bolivians | 100.0 /100 | #50 | Exceptional 11.2% |
| Immigrants | Bolivia | 100.0 /100 | #51 | Exceptional 11.3% |
| Immigrants | Australia | 99.9 /100 | #52 | Exceptional 11.3% |
| Immigrants | Lithuania | 99.9 /100 | #53 | Exceptional 11.3% |
| Eastern Europeans | 99.9 /100 | #54 | Exceptional 11.3% |