Ottawa vs Immigrants from Greece Divorced or Separated
COMPARE
Ottawa
Immigrants from Greece
Divorced or Separated
Divorced or Separated Comparison
Ottawa
Immigrants from Greece
13.2%
DIVORCED OR SEPARATED
0.0/ 100
METRIC RATING
308th/ 347
METRIC RANK
11.1%
DIVORCED OR SEPARATED
100.0/ 100
METRIC RATING
38th/ 347
METRIC RANK
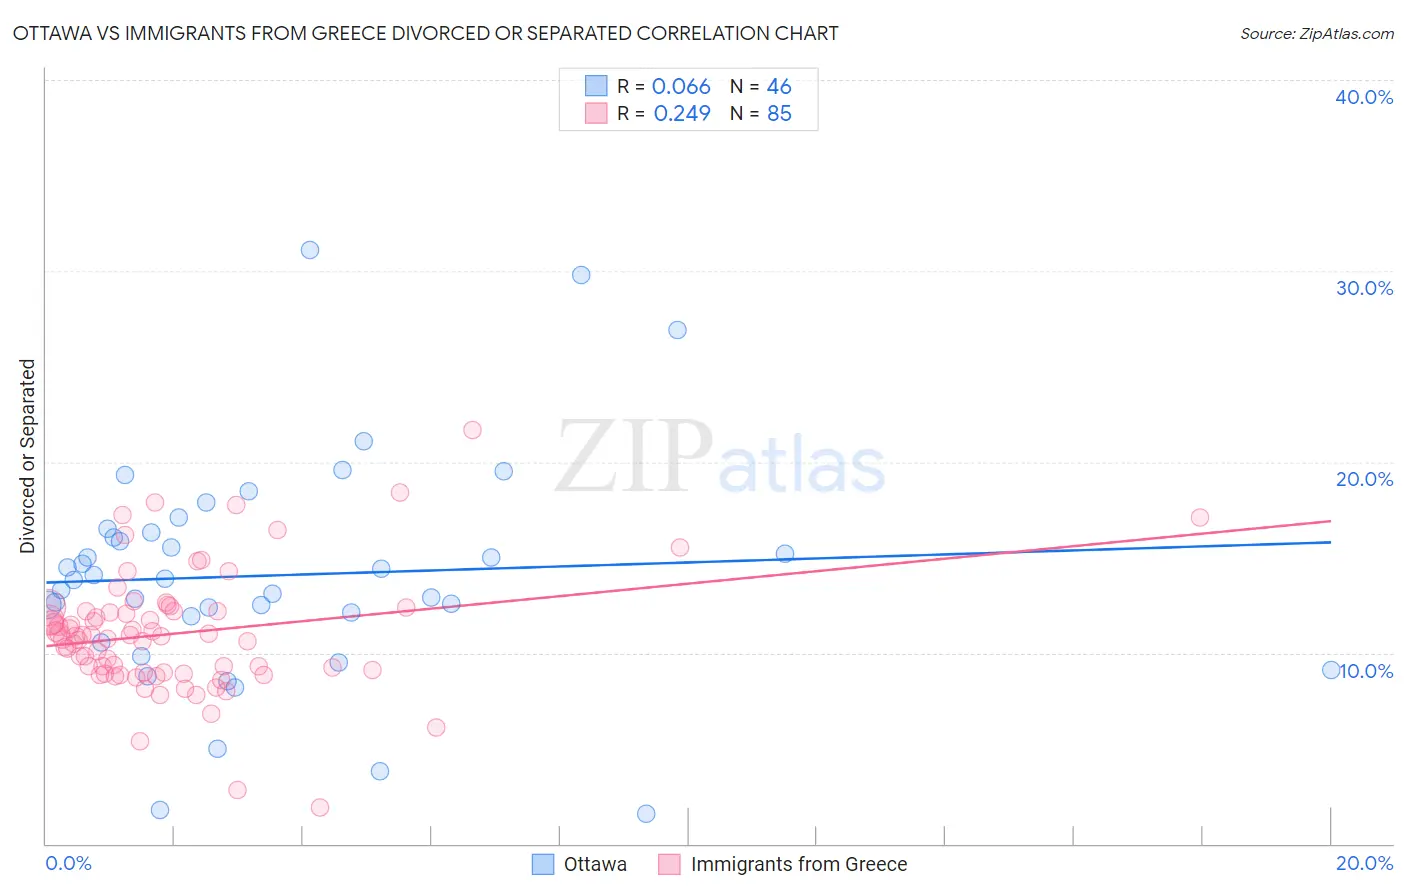
Ottawa vs Immigrants from Greece Divorced or Separated Correlation Chart
The statistical analysis conducted on geographies consisting of 49,956,568 people shows a slight positive correlation between the proportion of Ottawa and percentage of population currently divorced or separated in the United States with a correlation coefficient (R) of 0.066 and weighted average of 13.2%. Similarly, the statistical analysis conducted on geographies consisting of 216,866,276 people shows a weak positive correlation between the proportion of Immigrants from Greece and percentage of population currently divorced or separated in the United States with a correlation coefficient (R) of 0.249 and weighted average of 11.1%, a difference of 19.1%.
Divorced or Separated Correlation Summary
| Measurement | Ottawa | Immigrants from Greece |
| Minimum | 1.6% | 1.9% |
| Maximum | 31.1% | 21.7% |
| Range | 29.5% | 19.8% |
| Mean | 14.1% | 11.0% |
| Median | 13.8% | 10.9% |
| Interquartile 25% (IQ1) | 11.9% | 9.0% |
| Interquartile 75% (IQ3) | 16.3% | 12.2% |
| Interquartile Range (IQR) | 4.4% | 3.2% |
| Standard Deviation (Sample) | 6.0% | 3.2% |
| Standard Deviation (Population) | 5.9% | 3.2% |
Similar Demographics by Divorced or Separated
Demographics Similar to Ottawa by Divorced or Separated
In terms of divorced or separated, the demographic groups most similar to Ottawa are American (13.2%, a difference of 0.010%), African (13.2%, a difference of 0.030%), Sioux (13.2%, a difference of 0.050%), French American Indian (13.2%, a difference of 0.090%), and Tlingit-Haida (13.2%, a difference of 0.34%).
| Demographics | Rating | Rank | Divorced or Separated |
| Alaskan Athabascans | 0.0 /100 | #301 | Tragic 13.1% |
| Immigrants | Venezuela | 0.0 /100 | #302 | Tragic 13.1% |
| Cape Verdeans | 0.0 /100 | #303 | Tragic 13.1% |
| Hopi | 0.0 /100 | #304 | Tragic 13.2% |
| Chippewa | 0.0 /100 | #305 | Tragic 13.2% |
| Tlingit-Haida | 0.0 /100 | #306 | Tragic 13.2% |
| French American Indians | 0.0 /100 | #307 | Tragic 13.2% |
| Ottawa | 0.0 /100 | #308 | Tragic 13.2% |
| Americans | 0.0 /100 | #309 | Tragic 13.2% |
| Africans | 0.0 /100 | #310 | Tragic 13.2% |
| Sioux | 0.0 /100 | #311 | Tragic 13.2% |
| Blackfeet | 0.0 /100 | #312 | Tragic 13.3% |
| Immigrants | Nicaragua | 0.0 /100 | #313 | Tragic 13.3% |
| Yaqui | 0.0 /100 | #314 | Tragic 13.3% |
| Spanish Americans | 0.0 /100 | #315 | Tragic 13.3% |
Demographics Similar to Immigrants from Greece by Divorced or Separated
In terms of divorced or separated, the demographic groups most similar to Immigrants from Greece are Immigrants from Lebanon (11.1%, a difference of 0.060%), Immigrants from Japan (11.1%, a difference of 0.070%), Cambodian (11.1%, a difference of 0.13%), Immigrants from Uzbekistan (11.1%, a difference of 0.21%), and Immigrants from Egypt (11.1%, a difference of 0.24%).
| Demographics | Rating | Rank | Divorced or Separated |
| Mongolians | 100.0 /100 | #31 | Exceptional 11.1% |
| Tongans | 100.0 /100 | #32 | Exceptional 11.1% |
| Egyptians | 100.0 /100 | #33 | Exceptional 11.1% |
| Immigrants | Uzbekistan | 100.0 /100 | #34 | Exceptional 11.1% |
| Cambodians | 100.0 /100 | #35 | Exceptional 11.1% |
| Immigrants | Japan | 100.0 /100 | #36 | Exceptional 11.1% |
| Immigrants | Lebanon | 100.0 /100 | #37 | Exceptional 11.1% |
| Immigrants | Greece | 100.0 /100 | #38 | Exceptional 11.1% |
| Immigrants | Egypt | 100.0 /100 | #39 | Exceptional 11.1% |
| Soviet Union | 100.0 /100 | #40 | Exceptional 11.1% |
| Bhutanese | 100.0 /100 | #41 | Exceptional 11.2% |
| Chinese | 100.0 /100 | #42 | Exceptional 11.2% |
| Immigrants | Belarus | 100.0 /100 | #43 | Exceptional 11.2% |
| Immigrants | Western Asia | 100.0 /100 | #44 | Exceptional 11.2% |
| Turks | 100.0 /100 | #45 | Exceptional 11.2% |