Ottawa vs Immigrants from Central America Divorced or Separated
COMPARE
Ottawa
Immigrants from Central America
Divorced or Separated
Divorced or Separated Comparison
Ottawa
Immigrants from Central America
13.2%
DIVORCED OR SEPARATED
0.0/ 100
METRIC RATING
308th/ 347
METRIC RANK
12.1%
DIVORCED OR SEPARATED
42.9/ 100
METRIC RATING
183rd/ 347
METRIC RANK
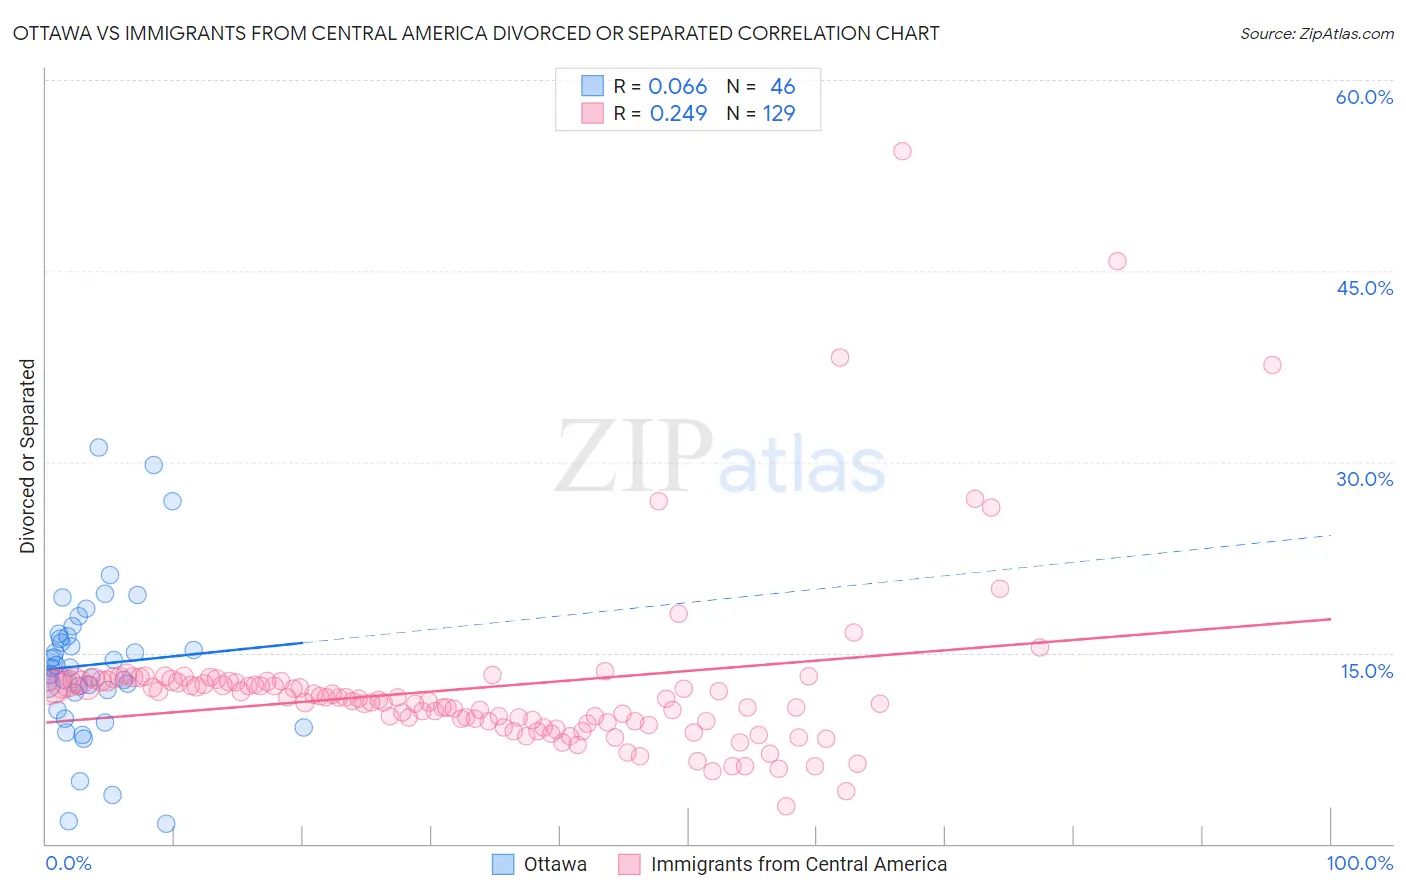
Ottawa vs Immigrants from Central America Divorced or Separated Correlation Chart
The statistical analysis conducted on geographies consisting of 49,956,568 people shows a slight positive correlation between the proportion of Ottawa and percentage of population currently divorced or separated in the United States with a correlation coefficient (R) of 0.066 and weighted average of 13.2%. Similarly, the statistical analysis conducted on geographies consisting of 536,242,690 people shows a weak positive correlation between the proportion of Immigrants from Central America and percentage of population currently divorced or separated in the United States with a correlation coefficient (R) of 0.249 and weighted average of 12.1%, a difference of 9.5%.
Divorced or Separated Correlation Summary
| Measurement | Ottawa | Immigrants from Central America |
| Minimum | 1.6% | 3.0% |
| Maximum | 31.1% | 54.4% |
| Range | 29.5% | 51.4% |
| Mean | 14.1% | 12.2% |
| Median | 13.8% | 11.3% |
| Interquartile 25% (IQ1) | 11.9% | 9.5% |
| Interquartile 75% (IQ3) | 16.3% | 12.7% |
| Interquartile Range (IQR) | 4.4% | 3.2% |
| Standard Deviation (Sample) | 6.0% | 6.8% |
| Standard Deviation (Population) | 5.9% | 6.7% |
Similar Demographics by Divorced or Separated
Demographics Similar to Ottawa by Divorced or Separated
In terms of divorced or separated, the demographic groups most similar to Ottawa are American (13.2%, a difference of 0.010%), African (13.2%, a difference of 0.030%), Sioux (13.2%, a difference of 0.050%), French American Indian (13.2%, a difference of 0.090%), and Tlingit-Haida (13.2%, a difference of 0.34%).
| Demographics | Rating | Rank | Divorced or Separated |
| Alaskan Athabascans | 0.0 /100 | #301 | Tragic 13.1% |
| Immigrants | Venezuela | 0.0 /100 | #302 | Tragic 13.1% |
| Cape Verdeans | 0.0 /100 | #303 | Tragic 13.1% |
| Hopi | 0.0 /100 | #304 | Tragic 13.2% |
| Chippewa | 0.0 /100 | #305 | Tragic 13.2% |
| Tlingit-Haida | 0.0 /100 | #306 | Tragic 13.2% |
| French American Indians | 0.0 /100 | #307 | Tragic 13.2% |
| Ottawa | 0.0 /100 | #308 | Tragic 13.2% |
| Americans | 0.0 /100 | #309 | Tragic 13.2% |
| Africans | 0.0 /100 | #310 | Tragic 13.2% |
| Sioux | 0.0 /100 | #311 | Tragic 13.2% |
| Blackfeet | 0.0 /100 | #312 | Tragic 13.3% |
| Immigrants | Nicaragua | 0.0 /100 | #313 | Tragic 13.3% |
| Yaqui | 0.0 /100 | #314 | Tragic 13.3% |
| Spanish Americans | 0.0 /100 | #315 | Tragic 13.3% |
Demographics Similar to Immigrants from Central America by Divorced or Separated
In terms of divorced or separated, the demographic groups most similar to Immigrants from Central America are Immigrants from Ethiopia (12.1%, a difference of 0.010%), Immigrants from Canada (12.1%, a difference of 0.040%), Immigrants from North America (12.1%, a difference of 0.060%), Barbadian (12.1%, a difference of 0.070%), and Immigrants from Western Europe (12.1%, a difference of 0.090%).
| Demographics | Rating | Rank | Divorced or Separated |
| Pennsylvania Germans | 48.9 /100 | #176 | Average 12.1% |
| Brazilians | 47.7 /100 | #177 | Average 12.1% |
| Ghanaians | 45.9 /100 | #178 | Average 12.1% |
| Immigrants | Western Europe | 45.6 /100 | #179 | Average 12.1% |
| Barbadians | 45.0 /100 | #180 | Average 12.1% |
| Immigrants | Canada | 44.0 /100 | #181 | Average 12.1% |
| Immigrants | Ethiopia | 43.1 /100 | #182 | Average 12.1% |
| Immigrants | Central America | 42.9 /100 | #183 | Average 12.1% |
| Immigrants | North America | 41.1 /100 | #184 | Average 12.1% |
| Immigrants | Nigeria | 40.5 /100 | #185 | Average 12.1% |
| Immigrants | Chile | 39.0 /100 | #186 | Fair 12.1% |
| Belizeans | 37.7 /100 | #187 | Fair 12.1% |
| Immigrants | Belize | 37.6 /100 | #188 | Fair 12.1% |
| Sierra Leoneans | 35.5 /100 | #189 | Fair 12.1% |
| Moroccans | 34.8 /100 | #190 | Fair 12.1% |