Indian (Asian) vs Immigrants from Poland Divorced or Separated
COMPARE
Indian (Asian)
Immigrants from Poland
Divorced or Separated
Divorced or Separated Comparison
Indians (Asian)
Immigrants from Poland
10.2%
DIVORCED OR SEPARATED
100.0/ 100
METRIC RATING
6th/ 347
METRIC RANK
11.2%
DIVORCED OR SEPARATED
100.0/ 100
METRIC RATING
47th/ 347
METRIC RANK
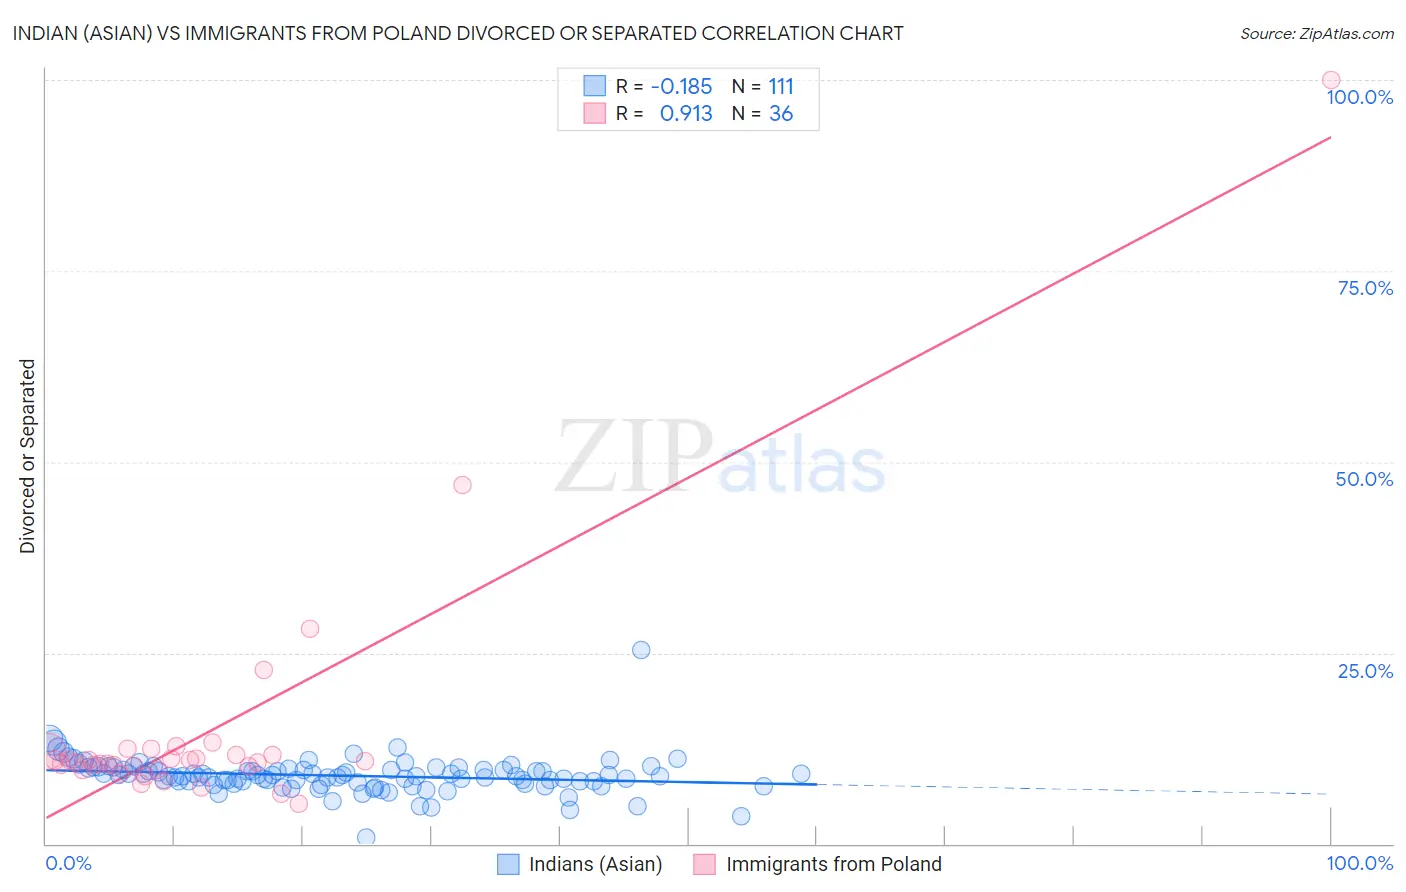
Indian (Asian) vs Immigrants from Poland Divorced or Separated Correlation Chart
The statistical analysis conducted on geographies consisting of 494,939,587 people shows a poor negative correlation between the proportion of Indians (Asian) and percentage of population currently divorced or separated in the United States with a correlation coefficient (R) of -0.185 and weighted average of 10.2%. Similarly, the statistical analysis conducted on geographies consisting of 304,831,025 people shows a near-perfect positive correlation between the proportion of Immigrants from Poland and percentage of population currently divorced or separated in the United States with a correlation coefficient (R) of 0.913 and weighted average of 11.2%, a difference of 9.9%.
Divorced or Separated Correlation Summary
| Measurement | Indian (Asian) | Immigrants from Poland |
| Minimum | 0.80% | 5.2% |
| Maximum | 25.4% | 100.0% |
| Range | 24.6% | 94.8% |
| Mean | 8.9% | 14.6% |
| Median | 8.8% | 10.7% |
| Interquartile 25% (IQ1) | 8.0% | 9.9% |
| Interquartile 75% (IQ3) | 9.8% | 11.9% |
| Interquartile Range (IQR) | 1.8% | 2.0% |
| Standard Deviation (Sample) | 2.4% | 16.3% |
| Standard Deviation (Population) | 2.4% | 16.1% |
Similar Demographics by Divorced or Separated
Demographics Similar to Indians (Asian) by Divorced or Separated
In terms of divorced or separated, the demographic groups most similar to Indians (Asian) are Thai (10.2%, a difference of 0.050%), Immigrants from Eastern Asia (10.2%, a difference of 0.39%), Yup'ik (10.3%, a difference of 0.83%), Immigrants from India (10.1%, a difference of 1.3%), and Immigrants from Singapore (10.3%, a difference of 1.4%).
| Demographics | Rating | Rank | Divorced or Separated |
| Immigrants | Taiwan | 100.0 /100 | #1 | Exceptional 9.8% |
| Filipinos | 100.0 /100 | #2 | Exceptional 9.9% |
| Immigrants | Hong Kong | 100.0 /100 | #3 | Exceptional 10.0% |
| Immigrants | China | 100.0 /100 | #4 | Exceptional 10.0% |
| Immigrants | India | 100.0 /100 | #5 | Exceptional 10.1% |
| Indians (Asian) | 100.0 /100 | #6 | Exceptional 10.2% |
| Thais | 100.0 /100 | #7 | Exceptional 10.2% |
| Immigrants | Eastern Asia | 100.0 /100 | #8 | Exceptional 10.2% |
| Yup'ik | 100.0 /100 | #9 | Exceptional 10.3% |
| Immigrants | Singapore | 100.0 /100 | #10 | Exceptional 10.3% |
| Immigrants | South Central Asia | 100.0 /100 | #11 | Exceptional 10.4% |
| Okinawans | 100.0 /100 | #12 | Exceptional 10.5% |
| Cypriots | 100.0 /100 | #13 | Exceptional 10.5% |
| Assyrians/Chaldeans/Syriacs | 100.0 /100 | #14 | Exceptional 10.6% |
| Immigrants | Armenia | 100.0 /100 | #15 | Exceptional 10.6% |
Demographics Similar to Immigrants from Poland by Divorced or Separated
In terms of divorced or separated, the demographic groups most similar to Immigrants from Poland are Laotian (11.2%, a difference of 0.010%), Immigrants from Turkey (11.2%, a difference of 0.030%), Immigrants from Saudi Arabia (11.2%, a difference of 0.040%), Bolivian (11.2%, a difference of 0.10%), and Turkish (11.2%, a difference of 0.12%).
| Demographics | Rating | Rank | Divorced or Separated |
| Soviet Union | 100.0 /100 | #40 | Exceptional 11.1% |
| Bhutanese | 100.0 /100 | #41 | Exceptional 11.2% |
| Chinese | 100.0 /100 | #42 | Exceptional 11.2% |
| Immigrants | Belarus | 100.0 /100 | #43 | Exceptional 11.2% |
| Immigrants | Western Asia | 100.0 /100 | #44 | Exceptional 11.2% |
| Turks | 100.0 /100 | #45 | Exceptional 11.2% |
| Laotians | 100.0 /100 | #46 | Exceptional 11.2% |
| Immigrants | Poland | 100.0 /100 | #47 | Exceptional 11.2% |
| Immigrants | Turkey | 100.0 /100 | #48 | Exceptional 11.2% |
| Immigrants | Saudi Arabia | 100.0 /100 | #49 | Exceptional 11.2% |
| Bolivians | 100.0 /100 | #50 | Exceptional 11.2% |
| Immigrants | Bolivia | 100.0 /100 | #51 | Exceptional 11.3% |
| Immigrants | Australia | 99.9 /100 | #52 | Exceptional 11.3% |
| Immigrants | Lithuania | 99.9 /100 | #53 | Exceptional 11.3% |
| Eastern Europeans | 99.9 /100 | #54 | Exceptional 11.3% |