Ottawa vs Immigrants from Kuwait Single Father Households
COMPARE
Ottawa
Immigrants from Kuwait
Single Father Households
Single Father Households Comparison
Ottawa
Immigrants from Kuwait
2.7%
SINGLE FATHER HOUSEHOLDS
0.1/ 100
METRIC RATING
285th/ 347
METRIC RANK
2.1%
SINGLE FATHER HOUSEHOLDS
99.8/ 100
METRIC RATING
71st/ 347
METRIC RANK
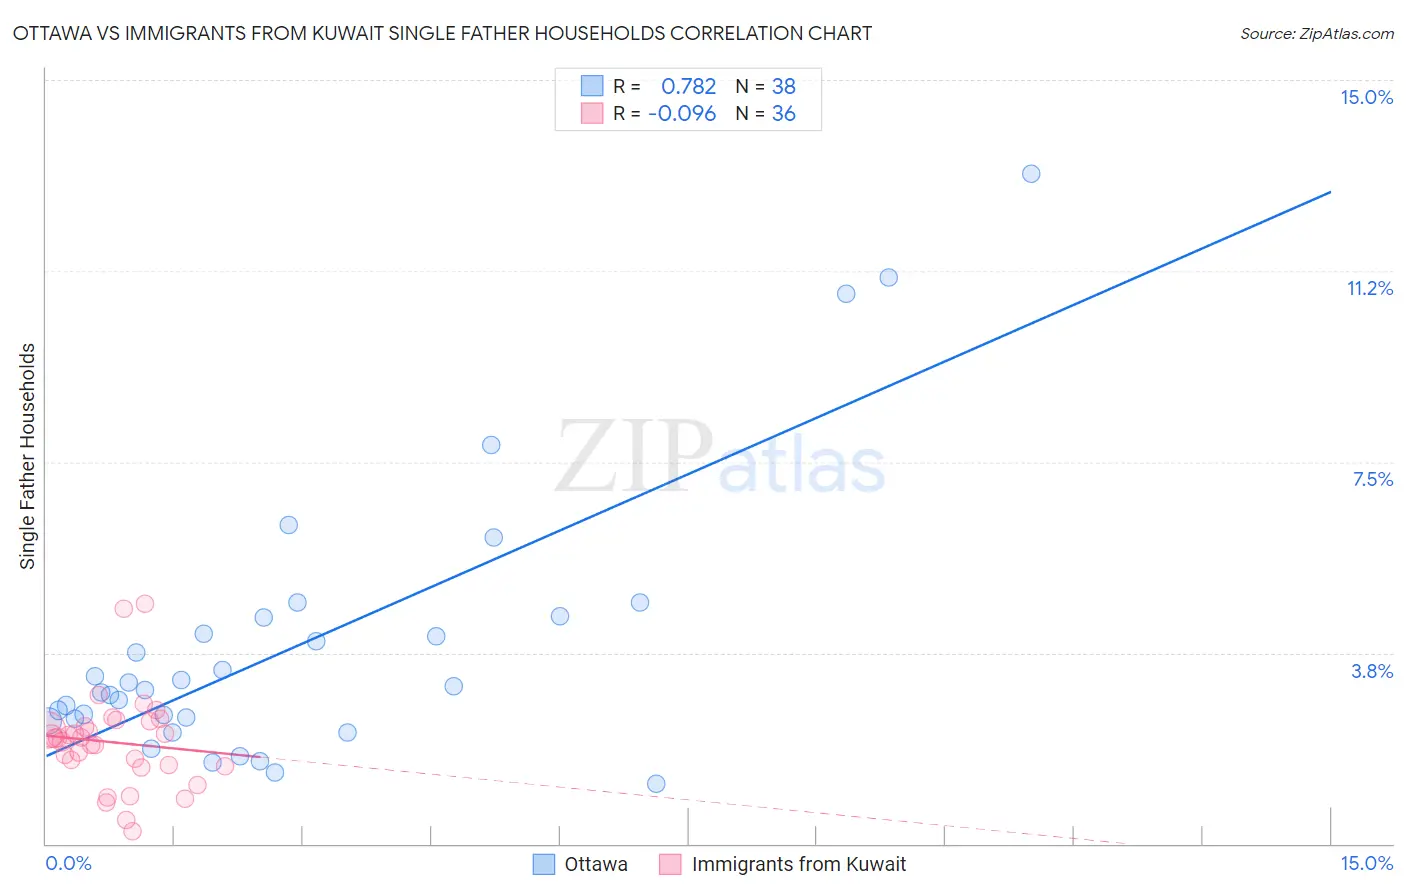
Ottawa vs Immigrants from Kuwait Single Father Households Correlation Chart
The statistical analysis conducted on geographies consisting of 49,872,808 people shows a strong positive correlation between the proportion of Ottawa and percentage of single father households in the United States with a correlation coefficient (R) of 0.782 and weighted average of 2.7%. Similarly, the statistical analysis conducted on geographies consisting of 136,715,758 people shows a slight negative correlation between the proportion of Immigrants from Kuwait and percentage of single father households in the United States with a correlation coefficient (R) of -0.096 and weighted average of 2.1%, a difference of 28.7%.
Single Father Households Correlation Summary
| Measurement | Ottawa | Immigrants from Kuwait |
| Minimum | 1.2% | 0.25% |
| Maximum | 13.2% | 4.7% |
| Range | 12.0% | 4.5% |
| Mean | 3.9% | 2.0% |
| Median | 3.1% | 2.1% |
| Interquartile 25% (IQ1) | 2.4% | 1.5% |
| Interquartile 75% (IQ3) | 4.4% | 2.3% |
| Interquartile Range (IQR) | 2.0% | 0.82% |
| Standard Deviation (Sample) | 2.7% | 0.91% |
| Standard Deviation (Population) | 2.7% | 0.90% |
Similar Demographics by Single Father Households
Demographics Similar to Ottawa by Single Father Households
In terms of single father households, the demographic groups most similar to Ottawa are Immigrants from Cuba (2.7%, a difference of 0.010%), Hawaiian (2.7%, a difference of 0.090%), Immigrants from Nicaragua (2.7%, a difference of 0.14%), Central American Indian (2.7%, a difference of 0.16%), and Immigrants from Cambodia (2.7%, a difference of 0.41%).
| Demographics | Rating | Rank | Single Father Households |
| Cherokee | 0.1 /100 | #278 | Tragic 2.6% |
| Samoans | 0.1 /100 | #279 | Tragic 2.6% |
| Immigrants | Portugal | 0.1 /100 | #280 | Tragic 2.6% |
| Nicaraguans | 0.1 /100 | #281 | Tragic 2.6% |
| Dutch West Indians | 0.1 /100 | #282 | Tragic 2.6% |
| Immigrants | Nicaragua | 0.1 /100 | #283 | Tragic 2.7% |
| Hawaiians | 0.1 /100 | #284 | Tragic 2.7% |
| Ottawa | 0.1 /100 | #285 | Tragic 2.7% |
| Immigrants | Cuba | 0.1 /100 | #286 | Tragic 2.7% |
| Central American Indians | 0.0 /100 | #287 | Tragic 2.7% |
| Immigrants | Cambodia | 0.0 /100 | #288 | Tragic 2.7% |
| Tlingit-Haida | 0.0 /100 | #289 | Tragic 2.7% |
| Puget Sound Salish | 0.0 /100 | #290 | Tragic 2.7% |
| Blackfeet | 0.0 /100 | #291 | Tragic 2.7% |
| Choctaw | 0.0 /100 | #292 | Tragic 2.7% |
Demographics Similar to Immigrants from Kuwait by Single Father Households
In terms of single father households, the demographic groups most similar to Immigrants from Kuwait are Immigrants from Spain (2.1%, a difference of 0.0%), Egyptian (2.1%, a difference of 0.010%), Immigrants from Bangladesh (2.1%, a difference of 0.15%), Immigrants from Egypt (2.1%, a difference of 0.15%), and Immigrants from Romania (2.1%, a difference of 0.22%).
| Demographics | Rating | Rank | Single Father Households |
| Mongolians | 99.9 /100 | #64 | Exceptional 2.1% |
| Paraguayans | 99.9 /100 | #65 | Exceptional 2.1% |
| Immigrants | Western Asia | 99.8 /100 | #66 | Exceptional 2.1% |
| Immigrants | Italy | 99.8 /100 | #67 | Exceptional 2.1% |
| Immigrants | Denmark | 99.8 /100 | #68 | Exceptional 2.1% |
| Immigrants | Romania | 99.8 /100 | #69 | Exceptional 2.1% |
| Egyptians | 99.8 /100 | #70 | Exceptional 2.1% |
| Immigrants | Kuwait | 99.8 /100 | #71 | Exceptional 2.1% |
| Immigrants | Spain | 99.8 /100 | #72 | Exceptional 2.1% |
| Immigrants | Bangladesh | 99.8 /100 | #73 | Exceptional 2.1% |
| Immigrants | Egypt | 99.8 /100 | #74 | Exceptional 2.1% |
| Immigrants | Sweden | 99.8 /100 | #75 | Exceptional 2.1% |
| Immigrants | Scotland | 99.8 /100 | #76 | Exceptional 2.1% |
| Immigrants | Saudi Arabia | 99.8 /100 | #77 | Exceptional 2.1% |
| Estonians | 99.7 /100 | #78 | Exceptional 2.1% |