Ottawa vs Danish Single Father Households
COMPARE
Ottawa
Danish
Single Father Households
Single Father Households Comparison
Ottawa
Danes
2.7%
SINGLE FATHER HOUSEHOLDS
0.1/ 100
METRIC RATING
285th/ 347
METRIC RANK
2.3%
SINGLE FATHER HOUSEHOLDS
48.2/ 100
METRIC RATING
176th/ 347
METRIC RANK
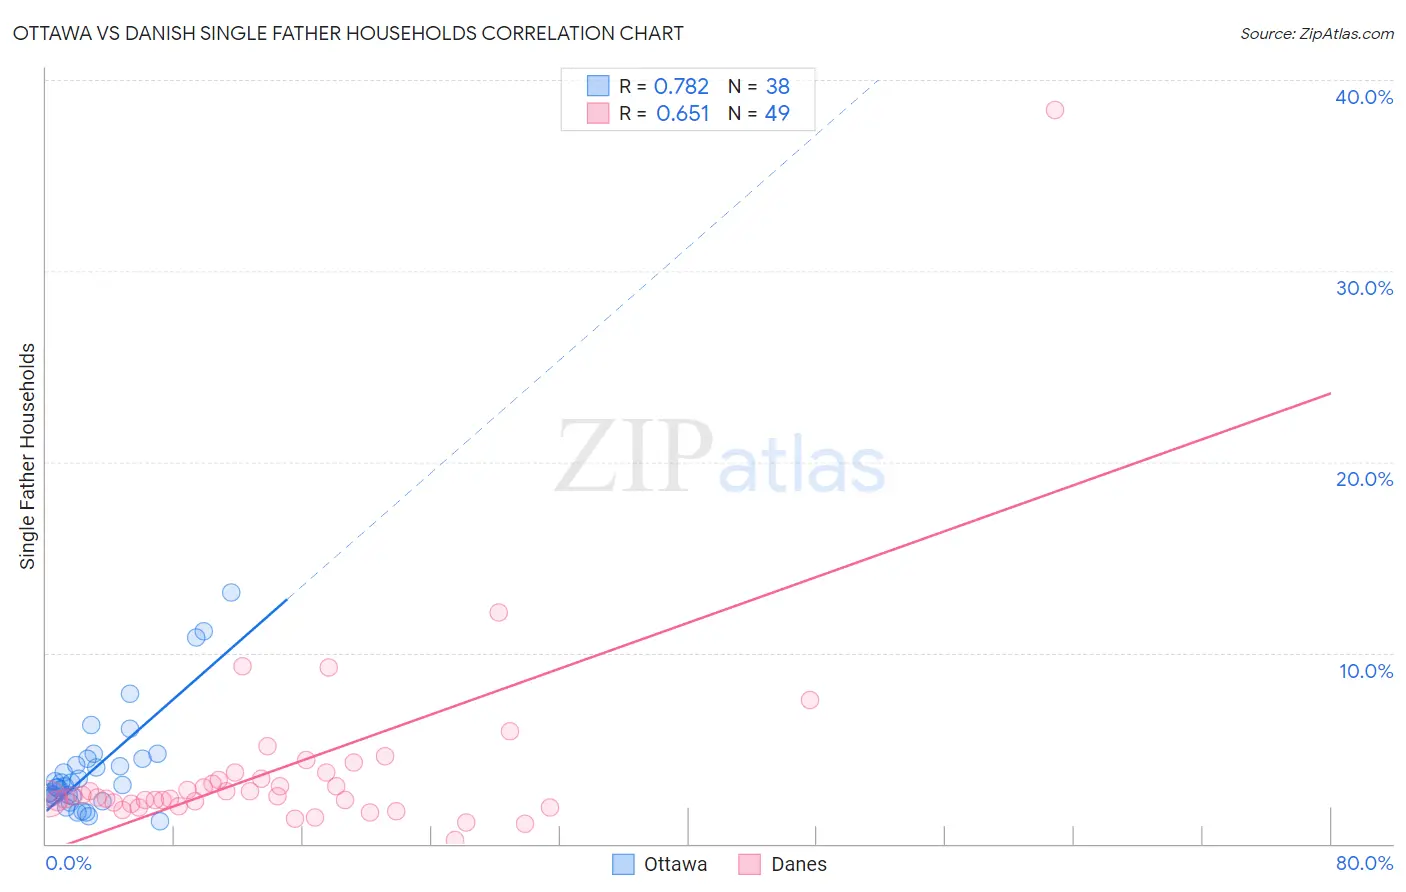
Ottawa vs Danish Single Father Households Correlation Chart
The statistical analysis conducted on geographies consisting of 49,872,808 people shows a strong positive correlation between the proportion of Ottawa and percentage of single father households in the United States with a correlation coefficient (R) of 0.782 and weighted average of 2.7%. Similarly, the statistical analysis conducted on geographies consisting of 466,880,679 people shows a significant positive correlation between the proportion of Danes and percentage of single father households in the United States with a correlation coefficient (R) of 0.651 and weighted average of 2.3%, a difference of 13.7%.
Single Father Households Correlation Summary
| Measurement | Ottawa | Danish |
| Minimum | 1.2% | 0.21% |
| Maximum | 13.2% | 38.5% |
| Range | 12.0% | 38.2% |
| Mean | 3.9% | 3.9% |
| Median | 3.1% | 2.5% |
| Interquartile 25% (IQ1) | 2.4% | 2.1% |
| Interquartile 75% (IQ3) | 4.4% | 3.6% |
| Interquartile Range (IQR) | 2.0% | 1.5% |
| Standard Deviation (Sample) | 2.7% | 5.5% |
| Standard Deviation (Population) | 2.7% | 5.5% |
Similar Demographics by Single Father Households
Demographics Similar to Ottawa by Single Father Households
In terms of single father households, the demographic groups most similar to Ottawa are Immigrants from Cuba (2.7%, a difference of 0.010%), Hawaiian (2.7%, a difference of 0.090%), Immigrants from Nicaragua (2.7%, a difference of 0.14%), Central American Indian (2.7%, a difference of 0.16%), and Immigrants from Cambodia (2.7%, a difference of 0.41%).
| Demographics | Rating | Rank | Single Father Households |
| Cherokee | 0.1 /100 | #278 | Tragic 2.6% |
| Samoans | 0.1 /100 | #279 | Tragic 2.6% |
| Immigrants | Portugal | 0.1 /100 | #280 | Tragic 2.6% |
| Nicaraguans | 0.1 /100 | #281 | Tragic 2.6% |
| Dutch West Indians | 0.1 /100 | #282 | Tragic 2.6% |
| Immigrants | Nicaragua | 0.1 /100 | #283 | Tragic 2.7% |
| Hawaiians | 0.1 /100 | #284 | Tragic 2.7% |
| Ottawa | 0.1 /100 | #285 | Tragic 2.7% |
| Immigrants | Cuba | 0.1 /100 | #286 | Tragic 2.7% |
| Central American Indians | 0.0 /100 | #287 | Tragic 2.7% |
| Immigrants | Cambodia | 0.0 /100 | #288 | Tragic 2.7% |
| Tlingit-Haida | 0.0 /100 | #289 | Tragic 2.7% |
| Puget Sound Salish | 0.0 /100 | #290 | Tragic 2.7% |
| Blackfeet | 0.0 /100 | #291 | Tragic 2.7% |
| Choctaw | 0.0 /100 | #292 | Tragic 2.7% |
Demographics Similar to Danes by Single Father Households
In terms of single father households, the demographic groups most similar to Danes are Colombian (2.3%, a difference of 0.010%), Immigrants from Jamaica (2.3%, a difference of 0.060%), Afghan (2.3%, a difference of 0.13%), Costa Rican (2.3%, a difference of 0.31%), and Welsh (2.3%, a difference of 0.31%).
| Demographics | Rating | Rank | Single Father Households |
| Czechs | 62.5 /100 | #169 | Good 2.3% |
| Ugandans | 62.2 /100 | #170 | Good 2.3% |
| Swedes | 61.6 /100 | #171 | Good 2.3% |
| Czechoslovakians | 58.9 /100 | #172 | Average 2.3% |
| Celtics | 55.4 /100 | #173 | Average 2.3% |
| Afghans | 50.0 /100 | #174 | Average 2.3% |
| Immigrants | Jamaica | 49.1 /100 | #175 | Average 2.3% |
| Danes | 48.2 /100 | #176 | Average 2.3% |
| Colombians | 48.0 /100 | #177 | Average 2.3% |
| Costa Ricans | 44.1 /100 | #178 | Average 2.3% |
| Welsh | 44.0 /100 | #179 | Average 2.3% |
| Yugoslavians | 43.9 /100 | #180 | Average 2.3% |
| Jamaicans | 43.5 /100 | #181 | Average 2.3% |
| Belgians | 43.3 /100 | #182 | Average 2.3% |
| Immigrants | Panama | 41.8 /100 | #183 | Average 2.4% |