Osage vs Haitian Single Father Households
COMPARE
Osage
Haitian
Single Father Households
Single Father Households Comparison
Osage
Haitians
2.5%
SINGLE FATHER HOUSEHOLDS
4.1/ 100
METRIC RATING
242nd/ 347
METRIC RANK
2.6%
SINGLE FATHER HOUSEHOLDS
0.4/ 100
METRIC RATING
268th/ 347
METRIC RANK
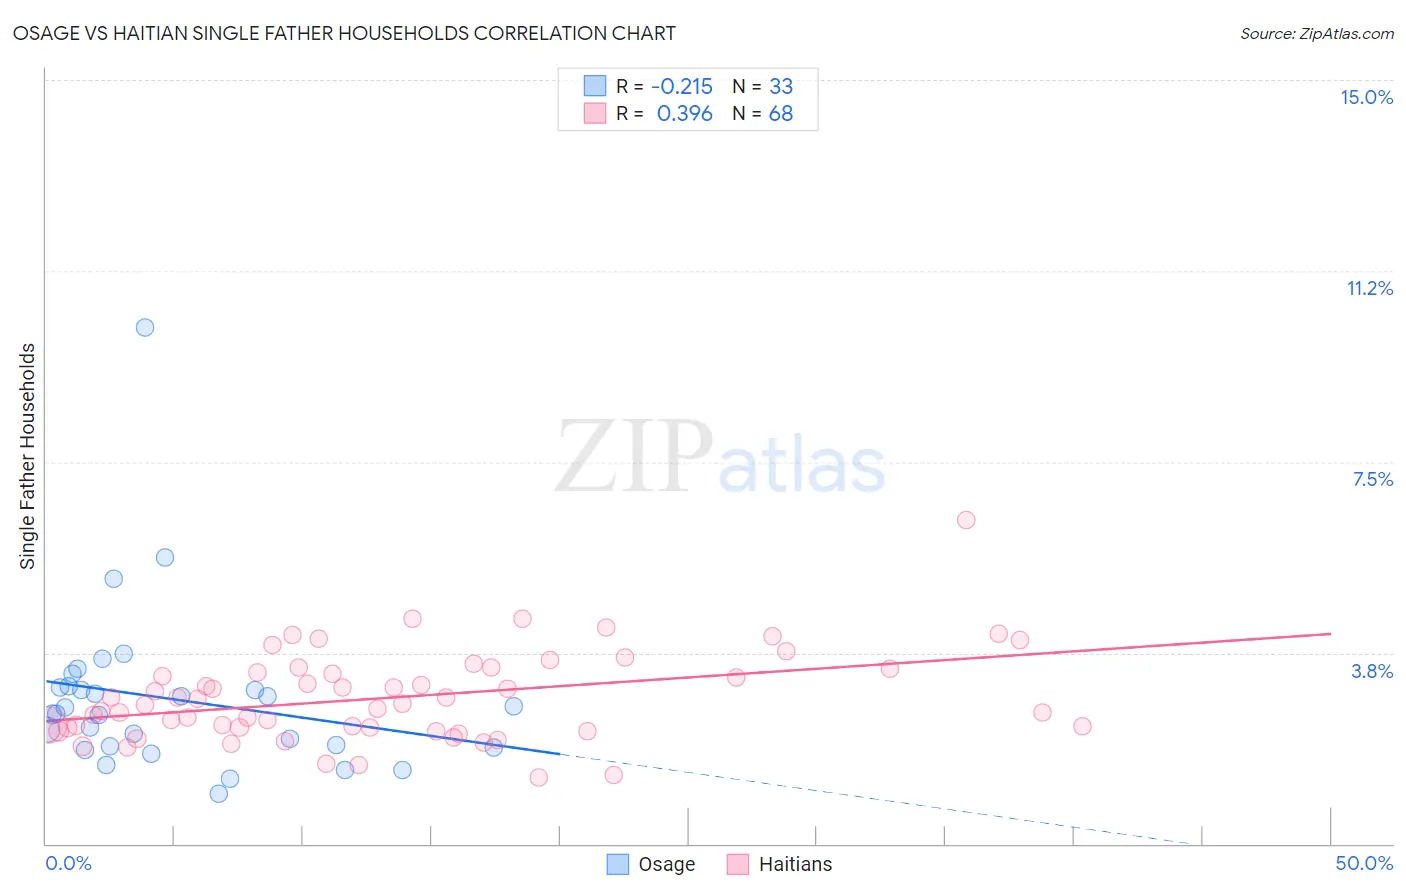
Osage vs Haitian Single Father Households Correlation Chart
The statistical analysis conducted on geographies consisting of 91,601,275 people shows a weak negative correlation between the proportion of Osage and percentage of single father households in the United States with a correlation coefficient (R) of -0.215 and weighted average of 2.5%. Similarly, the statistical analysis conducted on geographies consisting of 285,939,112 people shows a mild positive correlation between the proportion of Haitians and percentage of single father households in the United States with a correlation coefficient (R) of 0.396 and weighted average of 2.6%, a difference of 4.3%.
Single Father Households Correlation Summary
| Measurement | Osage | Haitian |
| Minimum | 0.98% | 1.3% |
| Maximum | 10.1% | 6.4% |
| Range | 9.2% | 5.1% |
| Mean | 2.8% | 2.9% |
| Median | 2.6% | 2.7% |
| Interquartile 25% (IQ1) | 1.9% | 2.3% |
| Interquartile 75% (IQ3) | 3.1% | 3.4% |
| Interquartile Range (IQR) | 1.2% | 1.1% |
| Standard Deviation (Sample) | 1.6% | 0.88% |
| Standard Deviation (Population) | 1.6% | 0.87% |
Similar Demographics by Single Father Households
Demographics Similar to Osage by Single Father Households
In terms of single father households, the demographic groups most similar to Osage are Portuguese (2.5%, a difference of 0.030%), Immigrants from Dominica (2.5%, a difference of 0.29%), Spaniard (2.5%, a difference of 0.46%), Immigrants from Oceania (2.5%, a difference of 0.65%), and Immigrants from Middle Africa (2.5%, a difference of 0.65%).
| Demographics | Rating | Rank | Single Father Households |
| Immigrants | Immigrants | 6.3 /100 | #235 | Tragic 2.5% |
| Cajuns | 6.1 /100 | #236 | Tragic 2.5% |
| Sierra Leoneans | 5.9 /100 | #237 | Tragic 2.5% |
| Immigrants | Sierra Leone | 5.8 /100 | #238 | Tragic 2.5% |
| Immigrants | Oceania | 5.8 /100 | #239 | Tragic 2.5% |
| Immigrants | Dominica | 4.8 /100 | #240 | Tragic 2.5% |
| Portuguese | 4.1 /100 | #241 | Tragic 2.5% |
| Osage | 4.1 /100 | #242 | Tragic 2.5% |
| Spaniards | 3.1 /100 | #243 | Tragic 2.5% |
| Immigrants | Middle Africa | 2.8 /100 | #244 | Tragic 2.5% |
| Basques | 2.5 /100 | #245 | Tragic 2.5% |
| Native Hawaiians | 2.5 /100 | #246 | Tragic 2.5% |
| Delaware | 2.5 /100 | #247 | Tragic 2.5% |
| Bahamians | 2.4 /100 | #248 | Tragic 2.5% |
| Immigrants | Cameroon | 2.3 /100 | #249 | Tragic 2.5% |
Demographics Similar to Haitians by Single Father Households
In terms of single father households, the demographic groups most similar to Haitians are Guamanian/Chamorro (2.6%, a difference of 0.040%), Cuban (2.6%, a difference of 0.34%), Seminole (2.6%, a difference of 0.48%), French American Indian (2.6%, a difference of 0.52%), and Immigrants from Micronesia (2.6%, a difference of 0.56%).
| Demographics | Rating | Rank | Single Father Households |
| Immigrants | Belize | 0.9 /100 | #261 | Tragic 2.5% |
| Immigrants | Liberia | 0.8 /100 | #262 | Tragic 2.5% |
| Dominicans | 0.8 /100 | #263 | Tragic 2.5% |
| Indonesians | 0.5 /100 | #264 | Tragic 2.6% |
| Immigrants | Micronesia | 0.5 /100 | #265 | Tragic 2.6% |
| French American Indians | 0.5 /100 | #266 | Tragic 2.6% |
| Guamanians/Chamorros | 0.4 /100 | #267 | Tragic 2.6% |
| Haitians | 0.4 /100 | #268 | Tragic 2.6% |
| Cubans | 0.3 /100 | #269 | Tragic 2.6% |
| Seminole | 0.3 /100 | #270 | Tragic 2.6% |
| Creek | 0.2 /100 | #271 | Tragic 2.6% |
| Belizeans | 0.2 /100 | #272 | Tragic 2.6% |
| Iroquois | 0.2 /100 | #273 | Tragic 2.6% |
| Puerto Ricans | 0.2 /100 | #274 | Tragic 2.6% |
| Immigrants | Dominican Republic | 0.2 /100 | #275 | Tragic 2.6% |