Immigrants from North Macedonia vs Aleut Family Households
COMPARE
Immigrants from North Macedonia
Aleut
Family Households
Family Households Comparison
Immigrants from North Macedonia
Aleuts
64.7%
FAMILY HOUSEHOLDS
84.9/ 100
METRIC RATING
140th/ 347
METRIC RANK
63.4%
FAMILY HOUSEHOLDS
1.9/ 100
METRIC RATING
239th/ 347
METRIC RANK
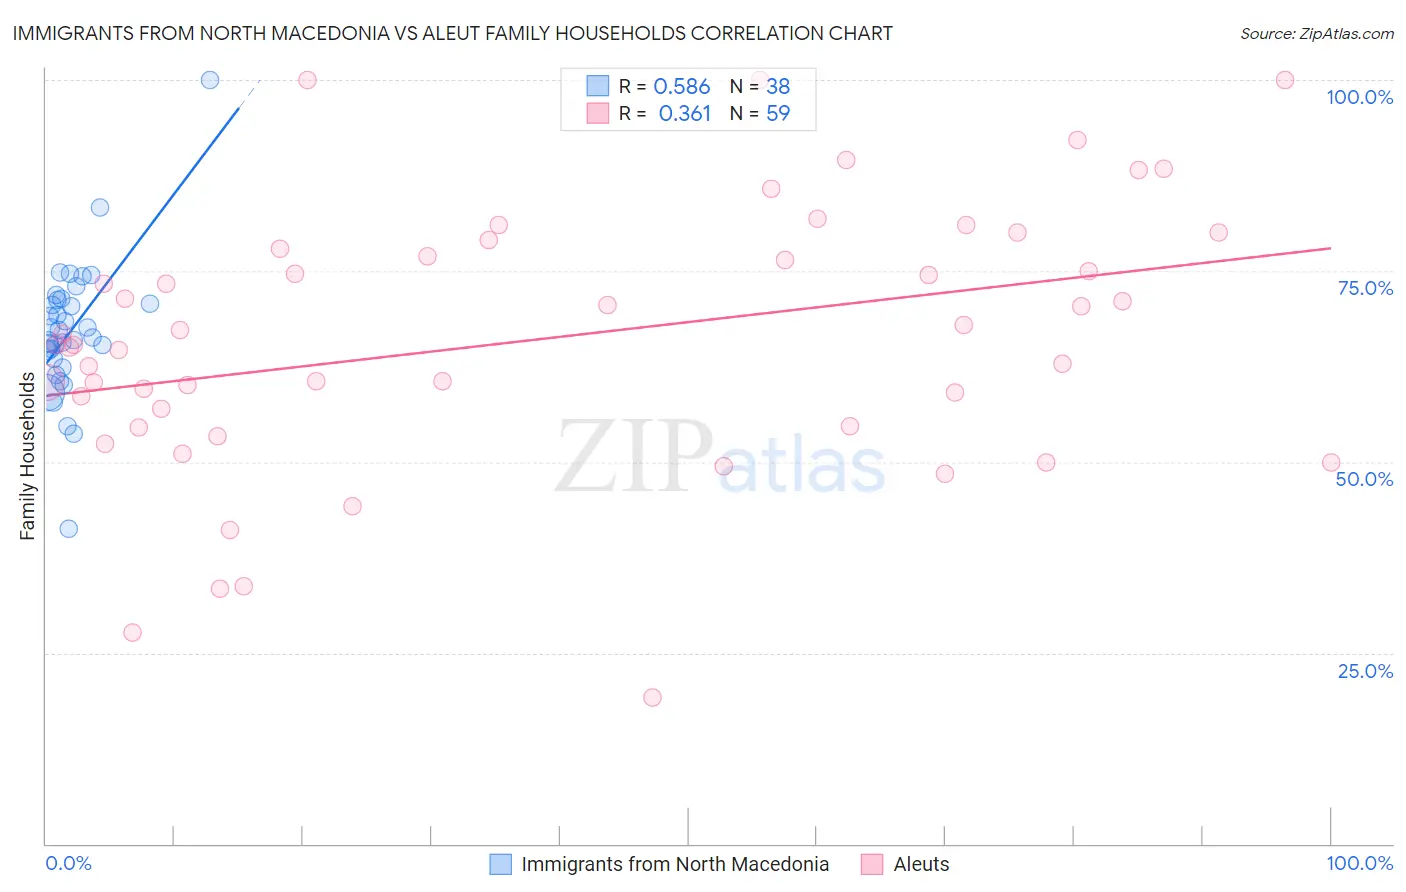
Immigrants from North Macedonia vs Aleut Family Households Correlation Chart
The statistical analysis conducted on geographies consisting of 74,306,697 people shows a substantial positive correlation between the proportion of Immigrants from North Macedonia and percentage of family households in the United States with a correlation coefficient (R) of 0.586 and weighted average of 64.7%. Similarly, the statistical analysis conducted on geographies consisting of 61,774,066 people shows a mild positive correlation between the proportion of Aleuts and percentage of family households in the United States with a correlation coefficient (R) of 0.361 and weighted average of 63.4%, a difference of 1.9%.
Family Households Correlation Summary
| Measurement | Immigrants from North Macedonia | Aleut |
| Minimum | 41.2% | 19.2% |
| Maximum | 100.0% | 100.0% |
| Range | 58.8% | 80.8% |
| Mean | 67.2% | 66.1% |
| Median | 66.7% | 65.4% |
| Interquartile 25% (IQ1) | 63.5% | 54.7% |
| Interquartile 75% (IQ3) | 71.2% | 77.9% |
| Interquartile Range (IQR) | 7.7% | 23.2% |
| Standard Deviation (Sample) | 9.1% | 17.3% |
| Standard Deviation (Population) | 9.0% | 17.2% |
Similar Demographics by Family Households
Demographics Similar to Immigrants from North Macedonia by Family Households
In terms of family households, the demographic groups most similar to Immigrants from North Macedonia are Immigrants from Cameroon (64.7%, a difference of 0.0%), Immigrants from Jamaica (64.7%, a difference of 0.010%), Basque (64.7%, a difference of 0.020%), Pakistani (64.7%, a difference of 0.020%), and Immigrants from China (64.7%, a difference of 0.040%).
| Demographics | Rating | Rank | Family Households |
| Belizeans | 89.3 /100 | #133 | Excellent 64.8% |
| Greeks | 88.1 /100 | #134 | Excellent 64.7% |
| Maltese | 87.4 /100 | #135 | Excellent 64.7% |
| Immigrants | China | 86.6 /100 | #136 | Excellent 64.7% |
| Immigrants | Scotland | 86.4 /100 | #137 | Excellent 64.7% |
| Basques | 85.5 /100 | #138 | Excellent 64.7% |
| Immigrants | Jamaica | 85.3 /100 | #139 | Excellent 64.7% |
| Immigrants | North Macedonia | 84.9 /100 | #140 | Excellent 64.7% |
| Immigrants | Cameroon | 84.8 /100 | #141 | Excellent 64.7% |
| Pakistanis | 84.0 /100 | #142 | Excellent 64.7% |
| Czechoslovakians | 82.1 /100 | #143 | Excellent 64.6% |
| South American Indians | 81.9 /100 | #144 | Excellent 64.6% |
| Welsh | 80.1 /100 | #145 | Excellent 64.6% |
| Immigrants | Romania | 77.0 /100 | #146 | Good 64.6% |
| Immigrants | Chile | 76.5 /100 | #147 | Good 64.6% |
Demographics Similar to Aleuts by Family Households
In terms of family households, the demographic groups most similar to Aleuts are South African (63.4%, a difference of 0.0%), Immigrants from St. Vincent and the Grenadines (63.4%, a difference of 0.010%), Immigrants from Israel (63.4%, a difference of 0.010%), Comanche (63.5%, a difference of 0.030%), and Immigrants from Zimbabwe (63.5%, a difference of 0.030%).
| Demographics | Rating | Rank | Family Households |
| Immigrants | Northern Africa | 2.6 /100 | #232 | Tragic 63.5% |
| Immigrants | Armenia | 2.6 /100 | #233 | Tragic 63.5% |
| Finns | 2.3 /100 | #234 | Tragic 63.5% |
| Albanians | 2.2 /100 | #235 | Tragic 63.5% |
| Ghanaians | 2.1 /100 | #236 | Tragic 63.5% |
| Comanche | 2.1 /100 | #237 | Tragic 63.5% |
| Immigrants | Zimbabwe | 2.0 /100 | #238 | Tragic 63.5% |
| Aleuts | 1.9 /100 | #239 | Tragic 63.4% |
| South Africans | 1.9 /100 | #240 | Tragic 63.4% |
| Immigrants | St. Vincent and the Grenadines | 1.9 /100 | #241 | Tragic 63.4% |
| Immigrants | Israel | 1.8 /100 | #242 | Tragic 63.4% |
| Immigrants | Czechoslovakia | 1.8 /100 | #243 | Tragic 63.4% |
| Eastern Europeans | 1.6 /100 | #244 | Tragic 63.4% |
| Immigrants | Dominica | 1.6 /100 | #245 | Tragic 63.4% |
| Immigrants | Ghana | 1.6 /100 | #246 | Tragic 63.4% |