Norwegian vs Trinidadian and Tobagonian Divorced or Separated
COMPARE
Norwegian
Trinidadian and Tobagonian
Divorced or Separated
Divorced or Separated Comparison
Norwegians
Trinidadians and Tobagonians
12.1%
DIVORCED OR SEPARATED
33.2/ 100
METRIC RATING
192nd/ 347
METRIC RANK
12.2%
DIVORCED OR SEPARATED
16.6/ 100
METRIC RATING
211th/ 347
METRIC RANK
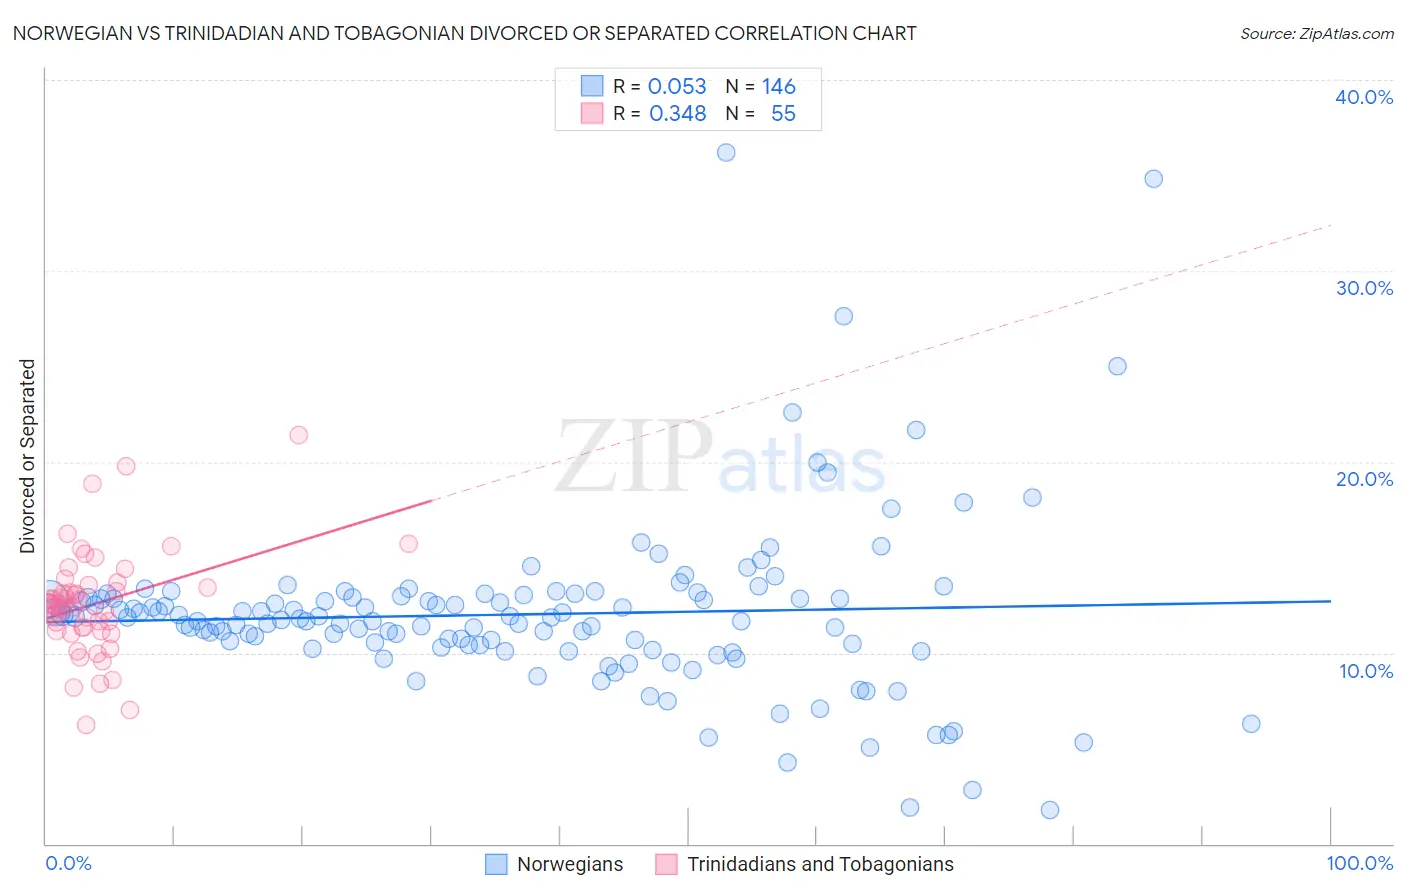
Norwegian vs Trinidadian and Tobagonian Divorced or Separated Correlation Chart
The statistical analysis conducted on geographies consisting of 533,039,037 people shows a slight positive correlation between the proportion of Norwegians and percentage of population currently divorced or separated in the United States with a correlation coefficient (R) of 0.053 and weighted average of 12.1%. Similarly, the statistical analysis conducted on geographies consisting of 219,763,096 people shows a mild positive correlation between the proportion of Trinidadians and Tobagonians and percentage of population currently divorced or separated in the United States with a correlation coefficient (R) of 0.348 and weighted average of 12.2%, a difference of 0.79%.
Divorced or Separated Correlation Summary
| Measurement | Norwegian | Trinidadian and Tobagonian |
| Minimum | 1.8% | 6.2% |
| Maximum | 36.2% | 21.4% |
| Range | 34.4% | 15.2% |
| Mean | 12.0% | 12.6% |
| Median | 11.8% | 12.5% |
| Interquartile 25% (IQ1) | 10.4% | 11.2% |
| Interquartile 75% (IQ3) | 12.9% | 13.5% |
| Interquartile Range (IQR) | 2.5% | 2.3% |
| Standard Deviation (Sample) | 4.5% | 2.8% |
| Standard Deviation (Population) | 4.5% | 2.7% |
Demographics Similar to Norwegians and Trinidadians and Tobagonians by Divorced or Separated
In terms of divorced or separated, the demographic groups most similar to Norwegians are Immigrants from Thailand (12.1%, a difference of 0.030%), Swedish (12.1%, a difference of 0.050%), Immigrants from Eritrea (12.1%, a difference of 0.050%), Immigrants from England (12.1%, a difference of 0.070%), and Immigrants from Burma/Myanmar (12.1%, a difference of 0.11%). Similarly, the demographic groups most similar to Trinidadians and Tobagonians are Slavic (12.2%, a difference of 0.020%), Immigrants from Trinidad and Tobago (12.2%, a difference of 0.070%), Immigrants from Ghana (12.2%, a difference of 0.13%), Slovak (12.2%, a difference of 0.25%), and Mexican (12.2%, a difference of 0.25%).
| Demographics | Rating | Rank | Divorced or Separated |
| Swedes | 34.4 /100 | #191 | Fair 12.1% |
| Norwegians | 33.2 /100 | #192 | Fair 12.1% |
| Immigrants | Thailand | 32.5 /100 | #193 | Fair 12.1% |
| Immigrants | Eritrea | 31.9 /100 | #194 | Fair 12.1% |
| Immigrants | England | 31.4 /100 | #195 | Fair 12.1% |
| Immigrants | Burma/Myanmar | 30.4 /100 | #196 | Fair 12.1% |
| Immigrants | Africa | 30.3 /100 | #197 | Fair 12.1% |
| Nigerians | 30.1 /100 | #198 | Fair 12.1% |
| Central Americans | 29.4 /100 | #199 | Fair 12.1% |
| South Americans | 28.6 /100 | #200 | Fair 12.2% |
| Guatemalans | 26.9 /100 | #201 | Fair 12.2% |
| Portuguese | 23.5 /100 | #202 | Fair 12.2% |
| Immigrants | Guatemala | 23.2 /100 | #203 | Fair 12.2% |
| Kenyans | 21.8 /100 | #204 | Fair 12.2% |
| Immigrants | Costa Rica | 21.3 /100 | #205 | Fair 12.2% |
| Slovaks | 21.0 /100 | #206 | Fair 12.2% |
| Mexicans | 21.0 /100 | #207 | Fair 12.2% |
| Immigrants | Ghana | 18.8 /100 | #208 | Poor 12.2% |
| Immigrants | Trinidad and Tobago | 17.8 /100 | #209 | Poor 12.2% |
| Slavs | 17.0 /100 | #210 | Poor 12.2% |
| Trinidadians and Tobagonians | 16.6 /100 | #211 | Poor 12.2% |